
Warning: You are viewing an older version of this documentation. Most recent is here: 42.2.0
Hunting
Introduction
Hunting is an interface dedicated to Threat Hunters and Cybersecurity Analysts for Signatures, Alerts, Sightings, Host Insights, events and services visualization and tuning.
Hunting uses a drill down approach to select events. Filters on metadata contained in the alerts events can be simply added by clicking on the magnifier icons next to the field value.
Once a composite filter is defined, the user can take an action based upon it. The action will be applied to all future events matching the composite filter.
In Enterprise Edition, Stamus probes can have actions/classifications applied for custom defined filters that are based on metadata.
It is easy to create a detailed filter that actually encompasses a lot of verbose/informational events that do not need further investigation. You can then choose to create an action that will classify any such events automatically in the future. To do so, click on Actions button in the right upper corner of the Hunt page. Select Tag, select the desired ruleset(s) for inclusion, click on Submit, click on the Update threat detection button icon on the top bar, right hand-side of the page, right next to the History button. By repeating that process for other relevant events, the system would eventually heal itself by classifying all the required data.
This comes with a great benefit of being able to filter out all informational classified events just by enabling/disabling the Informational switch (upper bar of the Hunt screen). Now you can concentrate on threat hunting the rest of the events - those that have not been classified Untagged and/or those that have already been classified as Relevant.
Top Menu Bar Options
Timespan drop down - here you can set a timespan to filter on
Help drop down - to access the embedded documentation and the about SCS information
User drop down - allows you to go to Account settings or Log Out
The Timespan drop-down allows you to choose between Presets and Date & Time Range.
The Presets can be:
hourly - last
1h,6hand24hdaily - last
2d,7dand30dmore - last
1yorAll
Important
All time range will set a time range from the first to the last stored alert.
Thus, it might have an earlier
Pages can be accessed via a click in the left menu. Jumping from one page to another will keep the filters untouched, allowing the analyst to alternate between the different views available.
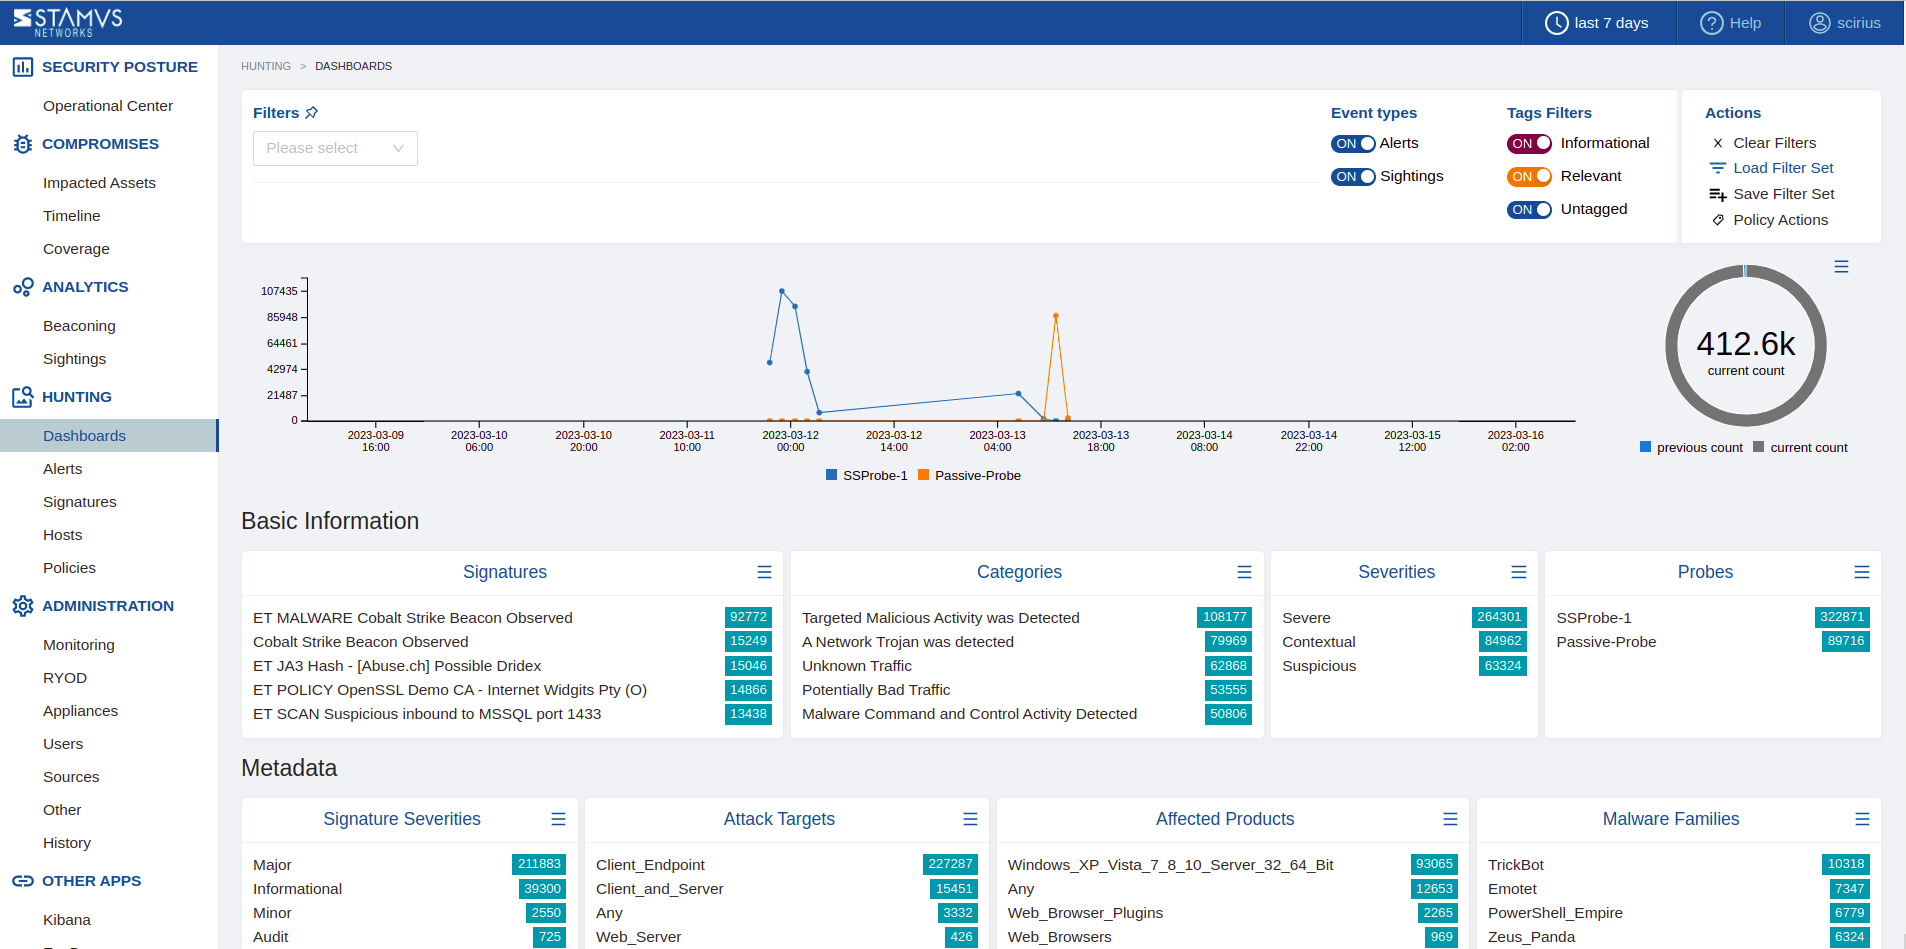
Dashboard
This page displays a dashboard with statistics about the most interesting data and metadata that can be seen in alerts. Here, any and all fields displayed can be selected or negated in order to make complex multiple filters combinations. These on demand filters allow to easily zero in on a research target or point of interest.
Note
The value of fields in this page can be copied to clipboard with a Ctrl + click shortcut.
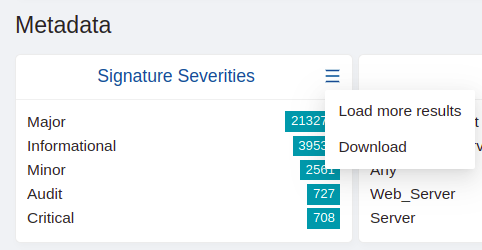
Another highly useful feature is that you can not only load additional results, but also download the content of any information panel by simply clicking on the kabab menu located in the upper-right corner.
Note
You can easily pin filters on the Dashboard page, as well as on the rest of the Hunting pages - Alerts, Signatures and Hosts. To do this, simply click on the pin icon next to the filter drop-down menu.
This will allow you to scroll through the whole page, keep the filters selection in your sight and add a new filter, if needed.
Alerts
This page displays the individual alert events as a list. It is possible to expand an event to
see all details about it, including Synthetic view, Related Alerts, Related events (by protocol type), JSON View, as well as some additional details, like PCAP file and Files.
Note
PCAP file and File options are available only, in case you have configured your Probe(s) in advance.
Any metadata displayed in the Synthetic view of an alert, can be further added or negated to the current display filter by simply clicking on the + or - magnifiers next to it.
You can copy the value of any field from the Related Alerts, Related Events, Json View with a Ctrl + click shortcut
Signatures
This page displays a list of signatures or a signature details page, in case a filter on a signature ID has been
created, or in case you click on the + or - magnifiers under Filter column of the signatures table. On the page you can set signature specific filters - for example, based on content of the signature title or number of hits a particular signature(s) have/has for a period of time.
From this page you can easily Enable/Disable Rule, or go to Rule Page in SCS, by clicking on the menu button under CTRL column on the Signatures table.
Host Insights
Each Host Insights page gives an overview of the network activity of the selected host IP. Host Insights tracks over 60 security-related network transactions and communication attributes of a host. This provides a single place to view many aspects of the network activity relative to a given host. It can help analysts gain valuable insights into the network services, hosted by the IP, application layer services used, HTTP user agents, SSH client/server agents/software and version used, encrypted connections fingerprinting, the username that was used to log in, the hostname, ML beacons detection and sightings observed and much more.
The page Hosts displays IP/host based threat detection profiling. In general, if other searches are done on different pages, those search filters will display alert based results for a set of hosts. In other words - this means that the page will display all hosts that have been involved in the set alerts, defined by the filters and the specified time range. For any profiled host, the following info is displayed, where available:
Services - seen running
Application Layers - seen used
Roles - Roles that this host has been detected doing. Ex: Domain Controller, Printer server, Proxy etc
HTTP Agents - seen from that host
TLS Agents - unique JA3s seen from that host
Usernames - seen to log in from that host
Hostnames - discovered from application layer events
Threats - DoCs (Declaration of Compromise) seen from that host
Sightings - New (perviously unseen in the organisation) communication from that host
Beacons - ML enabled beacons detected form that host
Signatures - alerts generated from/by that specific IP/host
Timeline - timeline of DoC events through the kill chain
The threat detection profiling of host in terms of Roles, Services, Application Layers, Beacons, Useragents, JA3, Usernames, Hostnames, Sightings is done entirely, based on Network Traffic Analyses and not on Alerts/Signatures.
The Hosts page has some specific filters that can be applied to your searches, like: Hosts: HTTP User Agent, Hosts: TLS JA4, Hosts: Username, Hosts: Counts, Hosts: Services and more. These filters can be very useful for analysts to narrow their investigations, when needed.
From Hosts page, you can easily navigate to the Host Insights page for any IP/host. To do this, you need to click on the icon, under Filters column of the hosts table.
The Host activity on the other hand, is another really useful section, where you can see the timeline of the attack - when it was detected and how it evolved over time.
This page also gives information on the Signatures that were triggered and is correlated to Threats, Sightings and Beacons, if such information is available for the specific Host.
Policy
This page displays the list of Actions constituting the policy applied to the alert events. The list is ordered and the filters are applied from top to bottom (in descending order). First filter is applied first, followed by the second and so forth.
The actions can be reordered (to adjust respective precedence of the filters), deleted or saved as Filter sets . To do any of these actions, simply click on the menu button on the right side of the Policy and fill in the relevant form.
To apply policies on probes
Note
To make sure an Action (example: Suppress, Threshold, Tag, Tag and Keep) is applied in production for all or a specific probe - update and push the respective ruleset(s).
You can do this from Policies page, by clicking on the Update/push ruleset button in the top right corner of the page.
Suppress
A Suppress action will delete matching events before they reach the storage. Any fields including metadata can be used to create a Suppress action.
Threshold
A Threshold action will only keep the alert when the defined threshold is reached. Any fields - including metadata, can be used to create a Threshold action.
Tag
A Tag action can be set based on a filter. It will be set on all matching events and will permit an easy categorization.
Currently 2 values are available:
Informational: information is just good enough to not be suppressed and is kept just in case
Relevant: event is relevant and an investigation is needed
All events that are not tagged can be found under the Untagged label, since there is no classification/Tag action that matches those events. So investigation and classification should be done.
Note
The Tag action is only available in Stamus Central Server
Tag and Keep
A Tag and keep action is similar to the Tag action but a matching event will not be suppressed or thresholded by any of the actions found later in the processing of actions.
Note
The Tag & Keep action is only available in Stamus Central Server
Understanding the search
Basic
When a magnifier button is used, a full string search is done on the key and value. This search can be edited (via the pen icon) to change the content. It will remains a full
string match as long as the wildcard search option is not activated.
Wildcard search
In Wildcard Searches - is possible by using either the * or the ? characters to search a substring.
Wildcard search is using a word tokenizer. By consequences, spaces are not allowed in wildcard search.
If you would like to search on a more complex strings containing whitespaces, as for example: Mozilla/4.0 (compatible; MSIE 6.0; Windows NT 5.1; SV1), your search will have to be separated into 2 different filters:
Filter on
*mozilla*, and,Filter on
*windows*
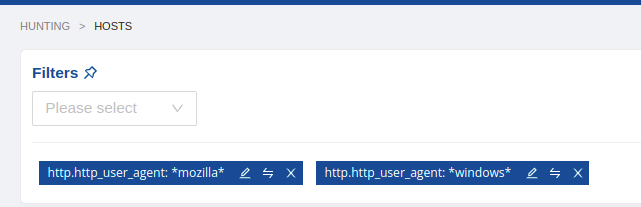
This is needed, due to some Elasticsearch specifics/restrictions. Thus, the search filter has to be matched on word boundaries.
Please also note that search filter are case insensitive.
Here is an example search on a specific type of Issuerdn for Certificates in use:
If you would like to search for all the issuerdn that contains search on *modo* would return:
issuerdncontaining:COMODOissuerdncontaining:Comodoissuerdncontaining:comodoand strings only, surrounded by spaces:
C=GB, ST=Greater Manchester, L=Salford, O=COMODO CA Limited, CN=COMODO RSA Extended Validation Secure Server CA
Search on *.com would return:
issuerdnending with:.com
Search on Google* would return:
issuerdnstarting with:Google
Note
You could also combine Wildcards when necessary
Search on ?oogle* would return:
issuerdnstarting with:Googleissuerdnstarting with:GOOGLEissuerdnstarting with:gOoGlEetc.
Host ID search
If understanding host ID search is obvious in the Host ID page as it is just a match on fields inside the host ID entries, their impact in other pages is really different. When a host ID filter is activated on a page like Alert, Hunt displays the alert events for the set of IP addresses matching the host ID filter. So for instance, if you want to see the attack on your Apache servers, just search for this HTTP server in host ID page and witch to the Alerts or Signature page.
Convert Host ID from/to alert search
Some fields are available in host ID and alert events. It is thus possible to switch from a search on host ID fields to a search on alert fields.
The interface allows this by clicking on the migration icon displayed on the right part of compatible filters.
Keyboard shortcuts
Tag filtering
Here is the complete list:
A: display all events
R: display only Relevant events
I: display only Informational events
U: display only Untagged events
Hunting Examples
Search by name
It is quite easy, regardless of the number of events, to search, whether a specific threat is present. Go to the Dashboard page, choose Message from the drop down menu at the top left corner of the page, type in Emotet, hit Enter on your keyboard. This will display any alert events and their related metadata, for any Signature that has alerted and contains the word Emotet in its message.
Hunt by IP
To simply filter on all events from or to a specific IP, you can go to Dashboard, Signatures or Hosts page, choose IP from the drop down menu at the top left corner of the page, and enter/paste the IP of interest, hit Enter on your keyboard.
Host intel triaging
If you have an IP search filter set in the Dashboard or Signatures pages, you can switch (by simply clicking on it) to the Hosts page. The result will display all hosts that have alerting events from or to that specific IP. You can further choose a host and expand in details its threat intel data gathered to further improve the investigation.
Unusual useragents
In the Dashboard page - scroll down to the HTTP Information panel, go to Useragent , click on the right upper corner of the box, click Load more results. Investigate the useragent names present. Look for suspicions/nontraditional names. To create a filter for a specific useragent - simply click on the magnifier icon, next to the field value. This will result in events and their metadata specific to that useragent. You can then go to Alerts page by simply clicking on it (left hand-side part of the current view). This will render all alert events relevant to that useragent.
Unusual domains
In the Dashboard page - scroll down to the DNS information panel, go to Name , click on the right upper corner of the box, click on Load more results. Investigate the domain names present. Look for suspicions/nontraditional/random names. To create a filter for a specific domain - simply click on the magnifier icons next to the field value. This will result in events and their metadata specific to that domain. You can then go to Alerts page by simply clicking on it (left hand-side part of the current view). This will render all alert events, relevant to that domain name.
Flip the search
In the Signatures page, choose Alerts min from the drop down menu at the top left corner of the page, type in 1, hit Enter on the keyboard. Now select Alerts max type in 5, hit Enter on the keyboard. This will result in displaying all signatures that have triggered between 1 and 5 alerts for the specific timespan. You can further choose to order them by asc or desc order, name, message or created date. That way you could aim at investigating low noise alert events.
To create a filter for a specific signature - simply click on the magnifier icon on the right hand-side of the displayed row. Then you can simply switch to Alerts page to see actual event examples or switch to Hosts page to see IP/host based threat detection profiling for that specific signature.
Find Alert events by Policy Actions
If you have multiple Policy Actions and want to find out which one has triggered an Alert Event, you need to do the following:
go to Alerts tab in Hunt -> click on the Alert of interest to unfold it
click on Json View tab and look for the
rule_filter_<number>:
"tag":"rule_filter_9"
use the following REST API endpoint to retrieve information on the rule filter
https://10.136.0.27/rest/rules/processing-filter/9/
Note
The above is an example link. 10.136.0.27 is the IP of SCS and 9 is the number of your rule filter.
scroll down to Filter defs form. There you will find information on:
Policy Action type (Tag, Tag and Keep, Suppress, etc.)
Options (Relevant, Informational)
Ruleset
Index - this is the index of the Policy Action
go back to Hunt -> Policy Actions tab
at the far right of the table, you will find the relevant indexes of your Policy Actions
Host ID basic search techniques
On Hosts page, you are able to use different search techniques to narrow down the results. It is possible among other things to search for hosts with a minimum or maximum count of services, as well as selecting hosts that run a specific version of an HTTP server. You can also simply look for hosts where a user (identified by its username) did connect.