Kibana Dashboards

Stamus Central Server embed the suite ELK and Kibana’s dashboards are accessible through the app switcher in the header.

Open Kibana. Once in Kibana, click on the Dashboard menu to see the full list of available dashboards. The use case examples below are for the purpose of idea generation and are not meant to be exhaustive.

Note

Any data from the Kibana dashboards or visualizations can be exported as CSV or PDF.

Dashboard

Description

Data types

Example Use Cases

SN-ALERTS

Alerts dashboard.

Alerts with metadata.

  • Audit or investigate a certain alert events with respect to common criteria such as Stamus Network Definitions, Networks, Ports, UserAgents, Domains, JA3s, JA3s etc.

  • Report of all Http user agents or source IPs for a certain alert.

SN-ALERTS-CVE

CVE specific alerts dashboard.

Alerts with metadata.

  • Report and overview metadata from CVE centric Alert dashboard.

  • Report on all domains seen related to a CVE (Log4j for example).

  • List all IPs scanning or answering for certain CVE.

SN-ALERTS-EXE-HUNT-1

Executables hunt and metadata export dashboard.

Alerts with metadata.

  • Audit or investigate on domain/IP/HTTP server/HTTP host/User agents/SMB clients etc that are most involved in plain executable transfers? What is the least?

SN-ALERTS-PHISHING

Phishing specific alerts dashboard.

Alerts with metadata.

  • Audit or investigate on domain/IP/HTTP server/HTTP host/HTTP host/User agents/ involved in possible phishing attempts.

SN-ALL

General events dashboard.

Any log type.

  • Audit or investigate on mixed events metadata, not just alerts.

SN-ANOMALY

Protocol anomaly events dashboard.

Anomaly events.

  • Audit or investigate on application Anomaly based events - for example top/bottom TLS versions/SNIs and IPs involved in TLS protocol anomaly.

SN-BEACONING-TLS

TLS beacons dashboard.

Beaconing events.

  • Audit or investigate on top TLS JA3S/JA3/SNI/Fingerprint/Subject involved int a specific beacon.

SN-DCERPC

DCERPC protocol events dashboard.

DCERPC logs.

  • Audit or investigate on Microsoft UUID and opnum usage.

SN-DHCP

DHCP protocol events dashboard.

DHCP logs.

  • Report and search on client/server MAC addresses usage

  • Audit or investigate DHCP servers seen on the network.

SN-DNP3

DNP3 protocol events dashboard.

DNP3 logs.

  • Audit or investigate on DNP3 function usage

SN-DNS

DNS protocol events dashboard.

DNS logs.

  • Audit or report on NXDOMAINS and the source IPs requesting those

  • Audit or investigate on AAAA domains.

  • List DNS ttl usage.

  • Audit or investigate on TCP or UDP DNS usage.

SN-DNS-HUNT-Tunnel

DNS tunnel detection and threat hunting dashboard.

DNS logs.

  • Report on and investigate on most DNS transactions per flow and the abusing hosts.

  • Report on and investigate on most and least domains used.

  • Report on and investigate on most subdomins.

SN-FILE-Transactions

File transactions protocol events dashboard.

Fileinfo, file transaction logs.

  • Audit or investigate on file type/magic in the enterprise.

  • Audit or investigate on most protocols used for file transfer.

  • Audit or investigate on size breakdown of files transfer at off business hours.

  • Audit or investigate on most/least used public hosts for clear text transfer (aka http/ftp etc).

  • Audit or investigate on most/least used NFS/SMB files.

SN-FLOW

Generic FLOW records dashboard.

Flow, netflow logs.

  • Investigate on protocol breakdown of biggest flows.

  • Investigate on flows bigger than 1Gb,10Gb,100Gb, top talkers off/on business hours.

  • Audit or investigate on most used Port/Networks.

  • I want to hunt on flow data specifically.

SN-FLOW-HTTP

HTTP flow records dashboard.

Flow logs specific to HTTP.

  • Investigate HTTP flows and occurrence.

  • Audit or investigate on any HTTP flow metric.

SN-FLOW-HUNT-DNS-EXFIL

Larger DNS flows dashboard. Possible exfil.

Flow logs specific to DNS.

  • Investigate DNS flows sizes and age.

  • Audit or investigate on DNS flow records

SN-FLOW-HUNT-ICMP-Possible-EXFIL

ICMP tunneling or exfil hunting dashboard.

Flow logs specific to ICMP.

  • Investigate and report on ICMP flows sizes and age.

  • Audit or investigate on ICMP flow records.

SN-FLOW-SIZE

Generic FLOW size based search dashboard.

Flow logs.

  • Investigate and report on flows sizes.

  • What are the top flow size talkers off business hours with flows bigger than 100GB

  • What are the top flow size talkers with flows bigger than 10GB

SN-FLOW-SMB

SMB flow records dashboard.

Flow logs specific to SMB.

  • Audit and report on SMB flows sizes.

  • What are the top SMB flow size talkers off business hours, from user networks with flows bigger than 1GB.

SN-FLOW-SSH

SSH flow records dashboard.

Flow logs specific to SSH.

  • Audit and report on SSH flows sizes.

  • What network hosts use SSH transfer bigger than 1GB off business hours.

  • What network hosts use SSH the most.

  • What network hosts use SSH the most from non IT management networks.

SN-FLOW-TCP

TCP flow records dashboard.

Flow logs specific to TCP.

  • Audit and report on TCP flows.

  • What are the top TCP flow size talkers off business hours with flows bigger than 1-20GB.

  • What are the top TCP flow size talkers with flows bigger than 200GB.

SN-FLOW-TLS

TLS flow records dashboard.

Flow logs specific to TLS.

  • Audit and report on TLS flows sources,destination networks and ports.

  • What are the top TLS flow size talkers off business hours with flows bigger than 1-20GB.

  • What are the most TLS flow sources during certain period of time.

  • What are the most TLS flow sources for specific TLS version.

SN-FLOW-UDP

UDP flow records dashboard.

Flow logs specific to UDP.

  • Audit or investigate on UDP flow usage over time

  • What are the biggest UDP flow sizes, from where.

SN-HTTP

HTTP protocol events dashboard.

HTTP logs.

  • Audit or investigate on any HTTP field.

  • List of all User Agents in the organisation.

  • List of all HTTP Servers software in the network.

  • List of all HTTP host names and connections in the network.

SN-HTTP-HUNT

HTTP protocol hunting dashboard.

HTTP logs.

  • Audit or investigate on HTTP rare occurrences of hostnames,User Agents etc.

  • Investigate on HTTP content lengths and method requests rom user networks.

SN-HUNT-1

All events hunting dashboard. IP or user search.

TLS, HTTP, DNS, Flow, SMB, KRB, ICMP, File transaction logs.

  • Investigate all protocol and file transaction data for a specific host over a specific time.

  • Incident response Audit or investigate on any protocol or alert field metadata for specific host.

  • Incident response

  • Audit connections and protocol usage from specific host or network for legacy app usage.

SN-IDS

Generic IDS alerts timelion dashboard.

Alert logs.

  • Timeline of specific alert or category over time.

  • Timeline of protocols or Geoip location of alerts.

SN-IKEv2

IKE protocol events dashboard.

IKE logs.

  • Audit or investigate on IKE top sources ,destinations, roles,versions.

SN-IoC-Search

IoC search and audit dashboard.

TLS, HTTP, DNS logs.

  • Check if specific domain(s) names have been seen in TLS SNIs , HTTP hostnames or DNS request/replies.

SN-KRB5

KRB5 protocol events dashboard.

KRB5 logs.

  • Audit or investigate on KRB5 protocol Encryption and message errors, user cnames and snames.

  • Audit and investigate KRB weak encryption occurrences.

SN-MQTT

MQTT protocol events dashboard.

MQTT logs.

  • Audit or investigate on MQTT top sources ,destinations,versions.

SN-NFS

NFS protocol events dashboard.

NFS logs.

  • Audit or investigate on top NFS talkers during a period of time.

  • Audit and investigate NFS file transactions and usage.

SN-Network-Overview

Network flow data overview dashboard.

Flow logs.

  • Investigate network statistics like Syn/Rst storms, IPv4/IPV6 usage from a Stamus networks probe area of deployment.

SN-Network-Overview-1

SN Probe Network flow data overview dashboard.

Flow logs.

  • Time graph report form a specific Stamus networks probe interface.

  • Network troubleshooting.

SN-Network-Overview-2

Network flow data overview dashboard.

Flow logs.

  • Audit or investigate on top flow volume clients.

  • Audit or investigate on top flow volume servers.

  • Audit or investigate on top single flows sizes going out of the network.

SN-OVERVIEW

General network overview dashboard.

Any logs.

  • Timeline based hunting by volume of transactions for DNS rtypes or NXDOMAINS.

  • Timeline of HTTP status code 4xx or 5xx.

  • Timeline of ICMP request/reply volumes.

SN-POLICY-OLD-TLS

Older or vulnerable TLS protocol encryption.

TLS logs.

  • Audit or investigate on any and all TLS records that use old TLS versions.

SN-POLICY-Violations

General Policy violations.

Alert logs.

  • Audit or investigate on clear text passwords.

  • Audit or investigate on known abused file sharing services.

  • Investigate and audit TOR connections present.

  • Investigate and report on external DNS resolvers.

  • Audit and report on vulnerable TLS protocol usage.

SN-POSTPROC-Stats

Post processing stats dashboard.

Stats logs.

  • Audit Stamus post processing statistics.

SN-RDP

RDP protocol events dashboard.

RDP logs.

  • List RDP versions and keyboard layouts used in the enterprise.

  • What are the top RDP host users.

SN-RFB

RFB protocol events dashboard.

RFB logs.

  • Is RFB used in my network and where.

  • What VLAN uses RFB.

  • What RFB authentication type is used in my network.

  • List all RFB server security failures.

SN-SIGHTINGS

Newly discovered communication never seen before.

TLS, HTTP, DNS, SMB, logs.

  • Check and export (CSV) any newly seen communication metadata.

  • Check and any newly seen internal or external HTTP servers.

  • Check and any newly seen TLS SNIs, Subject, Serial, Issuers, JA3(s).

  • Check and any newly seen HTTP User-Agents or Hostnames.

  • Check and any newly seen SMB executable transfers.

SN-SIGNATURE-Performance

Signature performance profiles

Signature profiling metrics on CPU ticks

  • Detect bad performance on signatures

  • Detect signatures responsible for performance issues

  • Adjust the default limit of 10 rules in expert mode Custom suricata runtime flags

SN-SIP

SIP protocol events dashboard.

SIP logs.

  • What are the most used SIP methods, sources and ports.

  • SIP usage over time.

SN-SMB

SMB protocol events dashboard.

SMB logs.

  • What are the SMB dialects offered and present in the network.

  • What are the most or least SMB filenames and shares used.

  • List of all SMB functions detected.

SN-SMB-DCERPC-Lateral-1

Stamus Networks Lateral Detection Dashboard

SMB logs.

  • Audit or investigate on UUID and OPNUM.

  • What are the most transactions per SMB/DCERPC flows.

  • Investigate status codes like SMB STATUS_ACCESS_DENIED.

SN-SMTP

SMTP protocol events dashboard.

SMTP logs.

  • Investigate encrypted e-mail usage

  • Investigate encrypted e-mail servers or addresses

SN-SNMP

SNMP protocol events dashboard.

SNMP logs.

  • Audit or investigate on SNMP version usage.

  • What are the SNMP communities advertised and used in the network.

  • What are the vlans using SNMP the most.

SN-SSH

SSH protocol events dashboard.

SSH logs.

  • Audit or investigate on SSH client or server software and version in the network.

  • What are the top or least SSH talkers in the network.

  • What are all the hosts that use specific SSH software.List of all SSH protocol events of those.

  • What are all the hosts that use specific SSH hash.

SN-STAMUS

Declarations of Compromise dashboard.

DoC logs.

  • Export report on Stamus DoC.

  • Create a list of IoCs

SN-TFTP

TFTP protocol events dashboard.

TFTP logs.

  • Is TFTP used in my network. What hosts use it.

  • List of all files and checksum transferred over TFTP.

SN-TLS

TLS protocol events dashboard.

TLS logs.

  • Audit or investigate on all TLS issuers in the network.

  • Audit all events and hosts that use a specific TLS certificate fingerprint.

  • Search for all TLS logs for a specific JA3/JA3S hash.

  • What are all the TLS versions seen on the network and from where.

  • Export and report on TLS connections not using port 443. What is using TLS port 18000.

SN-TrafficID

Social media dashboard.

Alert logs.

  • What is the top social media usage.

SN-VLAN

VLAN dashboard.

All logs.

  • What are all vlans seen in the network.

  • What vlans have the most SSH or DNS connections.

  • What vlans have the most file transfers from SMB.

  • What vlans have the most file transfers from FTP.

  • What vlans have the most file transfers from HTTP.

Export Kibana visualizations as CSV file

In order to export any of the visualizations on Kibana Dashboards as a CSV file, you need to do the following:

  1. Open the selected Dashboard

  2. Click on the three dots in the right hand corner of the visualization

Visualization menu
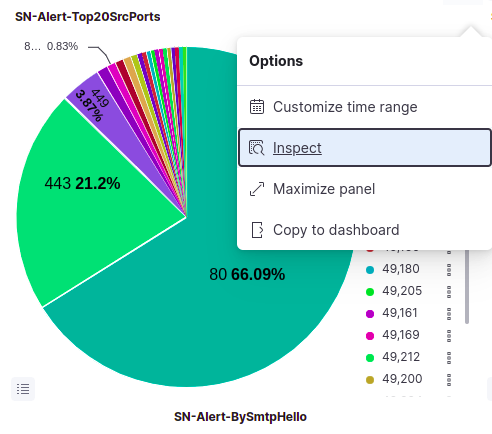
  1. From the menu -> click on
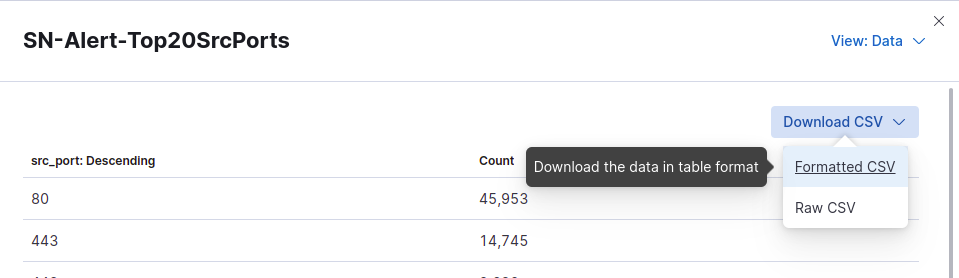
 Inspect

  2. A side menu will be loaded. From there, you need to click on Download CSV and choose the type of csv (formatted or raw).

Export Kibana visualization as CSV file

Export Kibana visualizations and dashbords from Stack Management

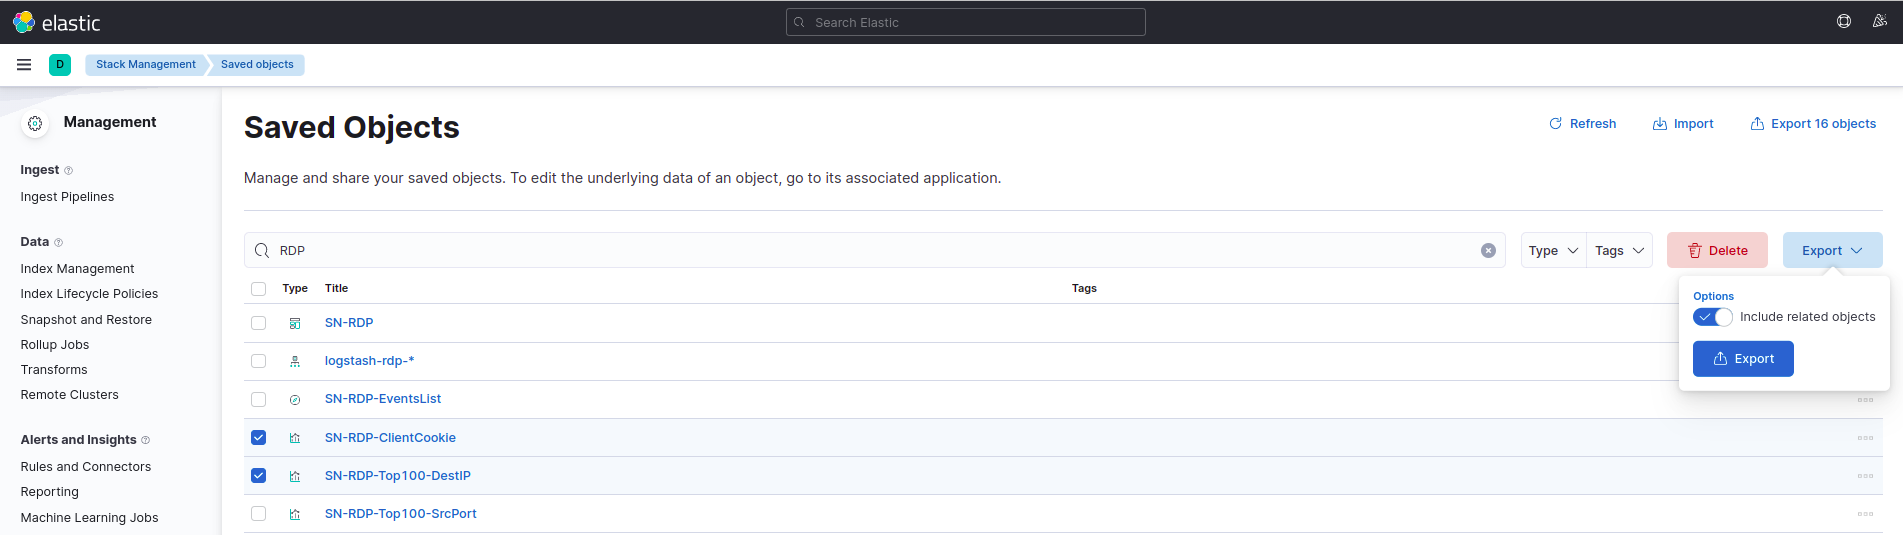
Another useful way to export Kibana Dashboards and/or Visualizations is to use the Saved Objects in Stack Management.

The feature also allows you to export multiple Dashboards and/or Visualizations.

In order to do the export, you need to go to Kibana menu -> Stack Management and click on Saved Objects.

You can use the search bar to look for a specific dashboard or visualization. Next, you have to select the checkbox for it and click on Export button on the right hand-side of the page.

Export Kibana Visualizations and Dashboards Stack Management

Edit Kibana visualizations

If you wish to edit an already existing visualization in Kibana, you can choose between two approaches to do this.

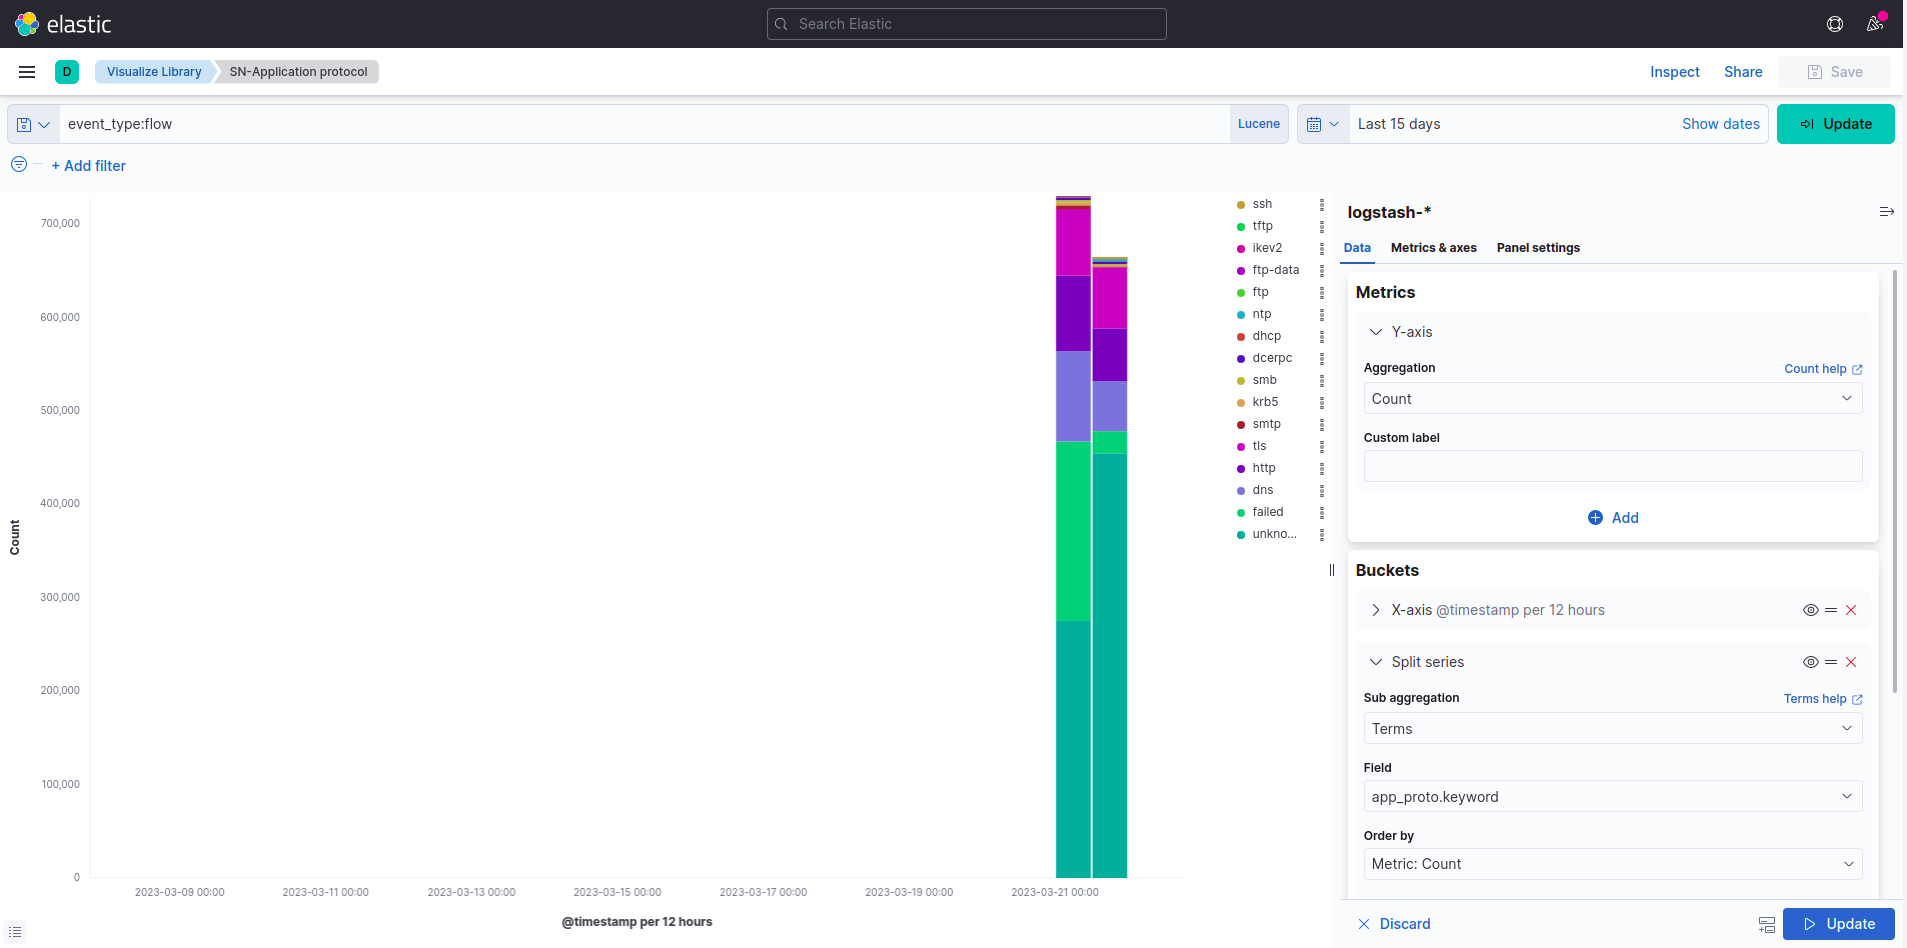
First approach is to use the Visualize Library. To access it you need to click on the menu, located in the top left-hand side of the page.

Next, you will see a list of all available visualizations. Choose the visualization you would like to edit and click on it.

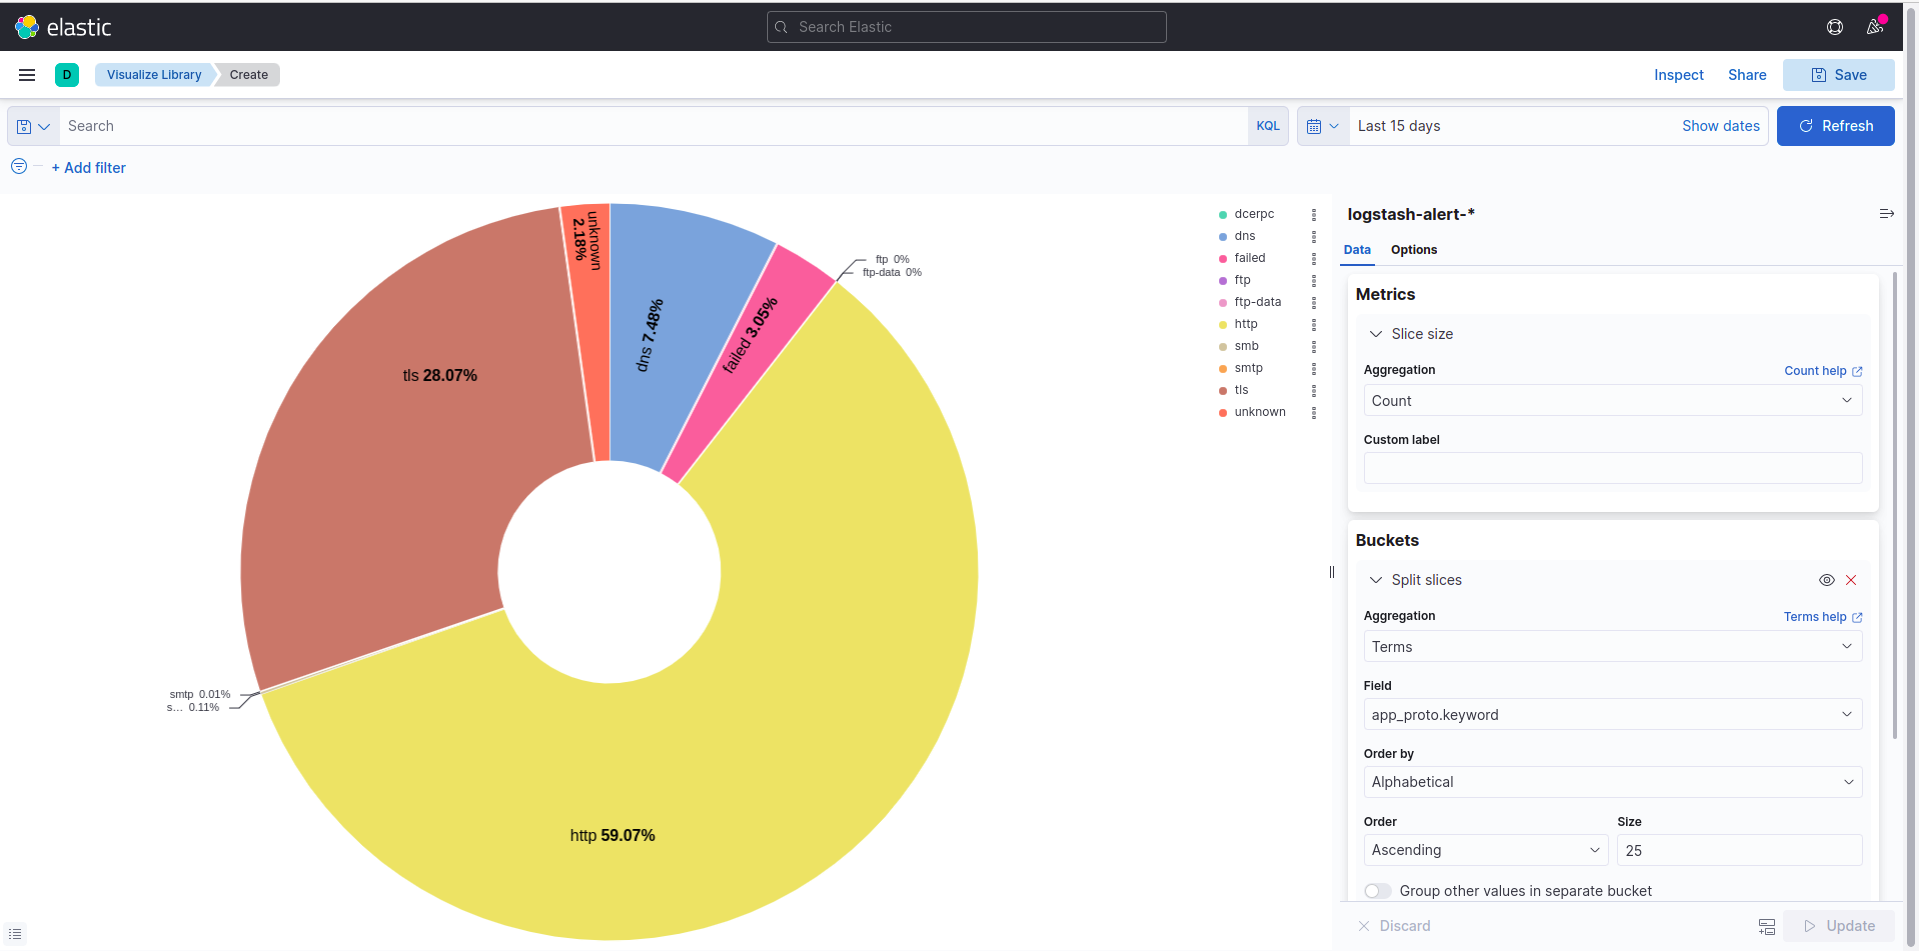
The visualization edition menu is on the right-hand side of the page. You can choose between editing Metrics and Buckets.

Once you have finished editing the visualization, you need to click on the Update button.

Edit Kibana Visualizations

Another approach to editing Kibana’s Visualizations is to do this directly from any Dashboard.

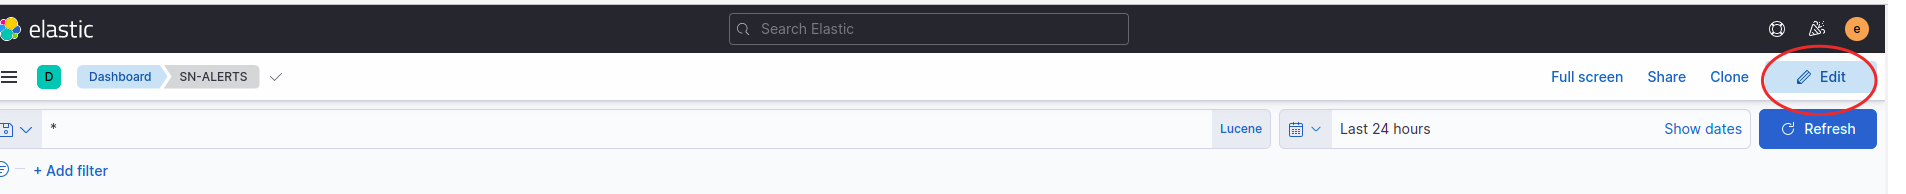
In order to do this, you have to go to a dashboard, then click on Edit button on the top right hand-side of the page.

Edit Button

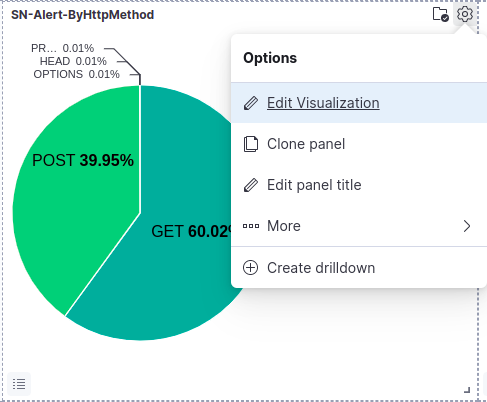
Next, you have to click on the gear icon at the top right-hand corner of the visualization you would like to edit and choose Edit Visualization

Edit Button

Create Kibana visualizations

If you would like to create your own visualizations, you should go to Kibana menu -> Visualize Library.

From there, click on Create visualization button and select the type of visualization, like Aggregation based, Lens, etc.

Next you should choose how to display your data. You can choose between Metric, Pie, Gouge, Data table, etc.

Once you have selected this, you need to choose the data source.

Note

Data sources in SCS are available by event type. Thus, TLS events are part of the logstash-tls* data source; DNS are part of the logstash-dns* data source, etc.

Finally, you have to configure your visualization, by choosing the relevant Metrics and Buckets.

Click on the Update button at the bottom right corner of the page in order to see your visualizaion.

Configure Kibana Visualization

Note

You might need to adjsut the time range in order to get relevant data.

Note

If you would like to save your newly created visualization, simply click on the Save button. Once you have saved it, you will be able to see it in the Visualize Library.