
Warning: You are viewing an older version of this documentation. Most recent is here: 42.2.0
Installing Stamus Central Server
This guide will cover the minimum steps to get you started and install Stamus Manager and a Stamus Network Probe.
Note
Before starting, make sure you reviewed and completed Preparing the Installation.
Installing the Manager and the Network Probe
Whether you are installing the Manager, or a Network Probe, the installation process is the same, as described below.
So, the first step is to install the Manager or a Network Probe is simply to boot from the ISO file. The installation process is mostly unattended and all you need to do is confirming and validating (press “y”) when the installer is going to partition the system.
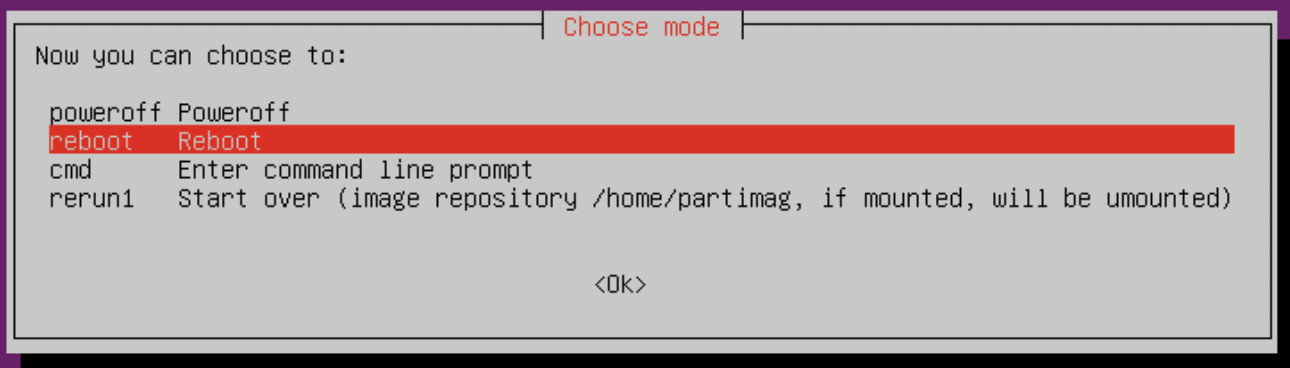
Once the system is installed, remove the ISO/DVD and reboot the system.
After the system has booted up, login using the defaults credentials snuser:snpasswd and change the password to fit your organization password policy using the passwd command.
Then, type in the command sudo stamus_config to set the minimum required parameters such as IP address, DNS server, NTP server, enable/disable DNSSec and so on.
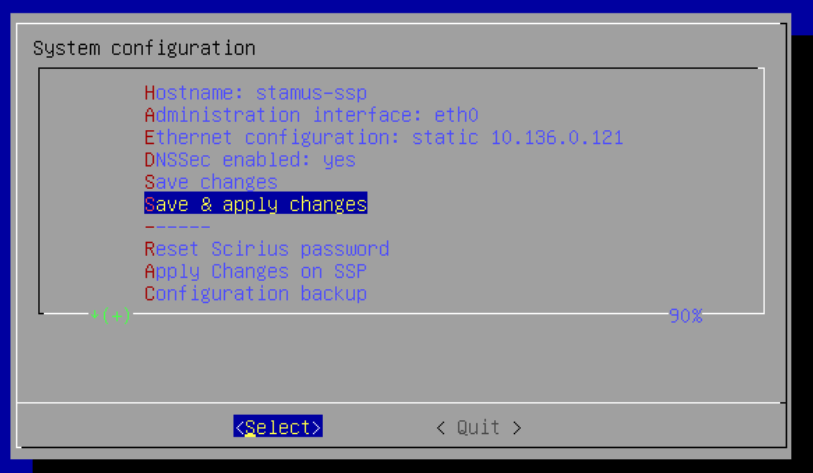
Once the parameters are set, Save & apply changes, exit stamus_config and reboot the system using sudo reboot
Installing the license
To be able to register and manage Network Probes, we first need to install a Stamus License on the Manager.
To do that, access with your browser to https://<IP_STAMUS_MANAGER> and use the default credentials scirius:scirius
Once logged in, go under Probe Management and click on the Stamus Networks logo in the upper left corner to pull down the menu. Select Systems license and in the left side Action menu, click on Get Unique SCS ID. Wait a few seconds for the system to generate your unique id file, download it and send it to support@stamus-networks.com.
You will receive back a license file to install.
After receiving the license file, follow the same path to go under Systems license and upload the license file.
Once the license is installed, you will see its expiration date, the number of network probes you can manage, the license number and 2 URLs (ET Pro and Stamus Threats).
Hint
Stamus Threats are automatically provisioned for Stamus users having a NDR license.
Registering a Network Probe
Now that we have our systems (manager and a network probe) installed, as well as a valid software license, let’s register our Network Probe so that we can manage it from the Manager.
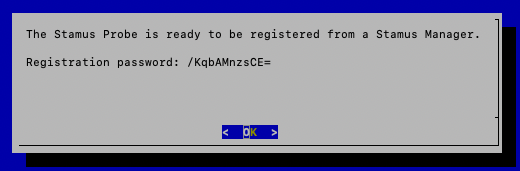
First, SSH to the Network Probe, then run sudo stamus_config and select Register probe. You will be presented with a temporary one-time password.
Let the SSH terminal aside, and open the Manager WebUI (https://<IP_STAMUS_MANAGER>).
Under Probe Management, go under Appliances in the header and select Add probe from the left side panel, then:
Set the type to Stamus Probe
Set the hostname such as Probe-1
Set the Address such as 10.44.1.25
Set the Password to what you obtained in the previous step, here
/KqbAMnzsCE=Add a description such as “This probe is in the accounting department”
We let template and ruleset unset for this initial setup (covered in dedicated documentation)
Finally, click on Submit
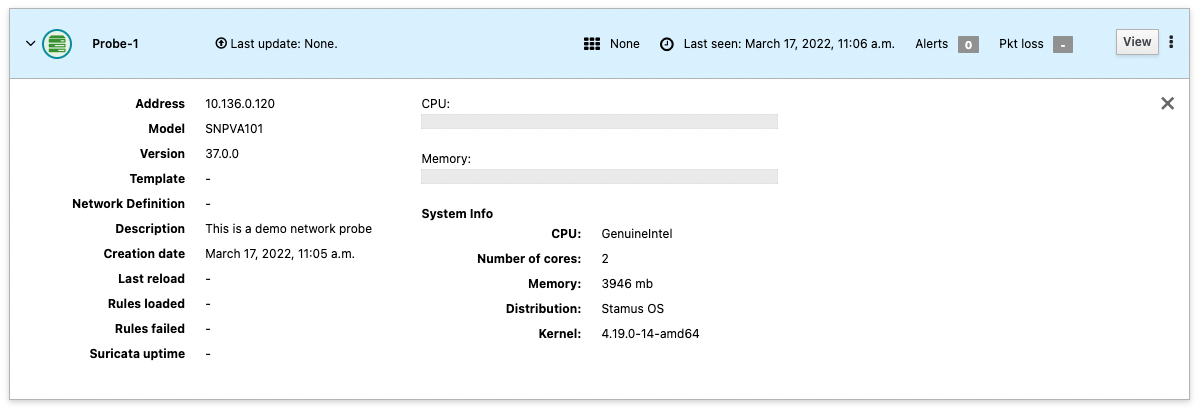
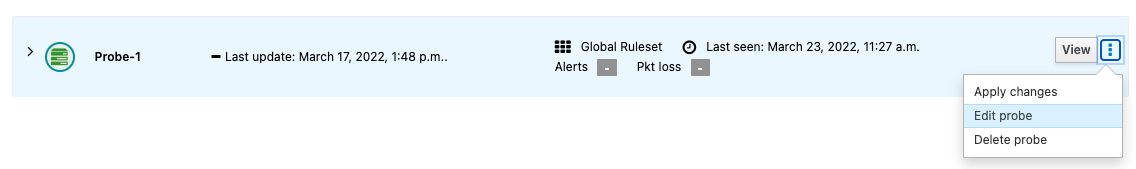
Once the network probe will be registered, you will be able to see it under the Appliances menu as shown in the following screenshot.
Hint
There are more options regarding registering a network probe which are covered in Probe Registration.
Hint
If you have multiple probes, it is a best practice to use Templates to configure them. The configuration will be defined at the template level and all probes using this template will inherit their configuration from it. See Probe Templates
Management IP address
Now that we have a network probe registered, we are going to adjust the Management IP address.
This address will be the IP address used by the Network Probes to communicate back to the Manager. Hence, it may differ from the IP address you are using to access the Manager depending on your environment (and if NAT is used for example).
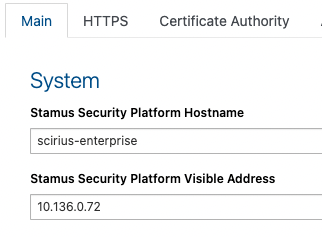
Once logged in in the Web UI, go under Probe Management and click on the Stamus Networks logo in the upper left corner to pull down the menu and select Global Appliance Settings.
From there, make sure you are on the Main tab and change the IP address under Stamus Central Server Visible Address to reflect your environment and hit Submit at the bottom of the page.
Finally, we need to apply those changes by clicking on Apply changes in the left panel. Select both the Manager and the Network Probe and click Apply.
Note
The visible address is an IP address in this example but it can also be a hostname if this hostname resolves correctly on all your Network Probes.
Adding public sources (optional)
The manager provides default public sources one can activate. Go under Sources from the header and enable the sources of your choice, such as ET/Open.
Note
Some public sources are bound to commercial terms and require a secret code or separate license. These are just configuration helpers for customers already having subscribed to those feeds, prior to purchasing a Stamus License.
Adding a Ruleset
Now that we have at least one source, we will create a ruleset that will use that source.
Note
A ruleset can use one or many sources and can be deployed on one or many network probes. See Sources & Rulesets
Go under Rulesets from the header menu and click on Add from the left side panel. Give your ruleset a name such as Global Ruleset and select the sources you want to add into it. Leave the other options to their default for now.
Click on the + Add button at the bottom of the page.
Attach the Ruleset to the Network Probe
Now, we need to attach the previously created ruleset to the desired network probes.
For that, go under Appliances from the header’s menu and edit the network probe by clicking on the “3 dots” on the right for the chosen network probe.
From the Basic tab, select the ruleset to use under Ruleset (no need to submit yet).
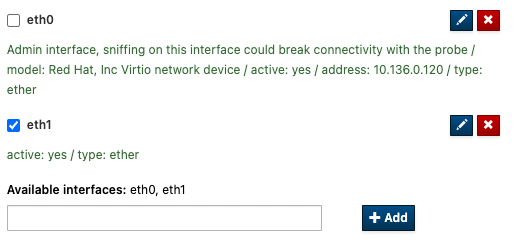
Then, from the Interfaces tab, select the sniffing interface and Submit the changes.
Finally, apply the changes (Appliances > Apply changes) on the modified network probes.
Note
If your sniffing interface doesn’t appear in the list of the interfaces, you can add it manually by typing its name under available interfaces and clicking on + Add.
Hint
If the Network Probe has multiple capture interfaces, adjust the threads accordingly from the Interface Settings. The number of threads per interface is equal to the number of CPU cores divided by the number of sniffing interfaces (round down). Threads numbers can be adjusted to account for bandwidth per interface but the total number of threads should never exceed the number of CPU cores.
Update the ruleset
We are almost done, all we need to do is to push/update the ruleset to update it on the Network Probes. Please refer to Updating Rulesets
Hint
It is a good practice to regularly update the rulesets such as once a day.