
Warning: You are viewing an older version of this documentation. Most recent is here: 42.2.0
Analytics
Beacons and Sightings detection require a NDR license.
Beaconing
Beacons are recurring communications that are often used by Malware to exfiltrate data or check back with a Command and Control server if new instructions await.
Hint
Beacons detection difficulties come from detecting very slow beacons such as one connection every few days as most detection systems aren’t designed to deal with such low frequency.
Stamus Central Server is capable of detecting slow beacons using Machine Learning, including very slow beacons. Our algorithms don’t have time boundaries.
In practice, we have commonly observed malware sending few beacons per day or per week which our system is capable of detecting easily.
Beacon Metric
Stamus Central Server computes a Beacon Metric which is a weighted score prioritizing TLS servers exhibiting behavior patterns typically associated with beaconing traffic. In other words, communications with clear periodicity or flat byte and specific packet profiles are highlighted by this mechanism.
For example, a command and control (C2) callback beacons are periodic outbound connections for maintaining persistence. They call home at specific intervals, though they can also be configured to vary that callback with predefined jitter. Most callbacks also deliver the same amount of data per request and response.
Our system first performs frequent item detection to profile the TLS traffic for your organization and exclude them from the beacon analysis.
Remaining connections are therefore infrequent, and have heightened risk of being a beacon. From these remaining connections, statistical measurements are collected for each potential beacon.
Stamus Central Server performs many statistical measurements, which taken individually, are not enough to characterize a beacon. However, the combination of these statistical measurements result in a beacon metric, a single unique value to sort the tracking table.
The beacon metric can range from 0 to 100. Entries at the top exhibit beaconing patterns more strongly than entries at the bottom.
Note that many legitimate communications often also exhibit beaconing patterns. For example, software updates, API calls, telemetry services, etc. Our system tries to deprioritize these entries by analyzing Server Name Indicators (SNI) to identify known services. Nevertheless, it is normal to see these in the beaconing tab because they may indicate policy violations or abnormal findings in the network.
This beacon metric being an indicator of likelihood, the best approach is to use it as a starting point for investigation (and then look at the SNI(s) for example in the details page).
The beacon metric is not a percentage that a particular entry is a beacon. It simply prioritizes more relevant entries for investigation.
For a potential beaconing entry:
Investigate TLS SNI values to identify if this is a malicious domain or a known service (for example, Microsoft update services vs a randomly generated domain)
Investigate TLS issuer, self-signed certificates or Let’s Encrypt are often used by malicious servers;
Investigate the traffic profile to see if connections occur at specific intervals or if the data profile is flat;
Important
In no way this beacon metric should be interpreted as a “percentage of chances” as this metric is a relative statistical measurement.
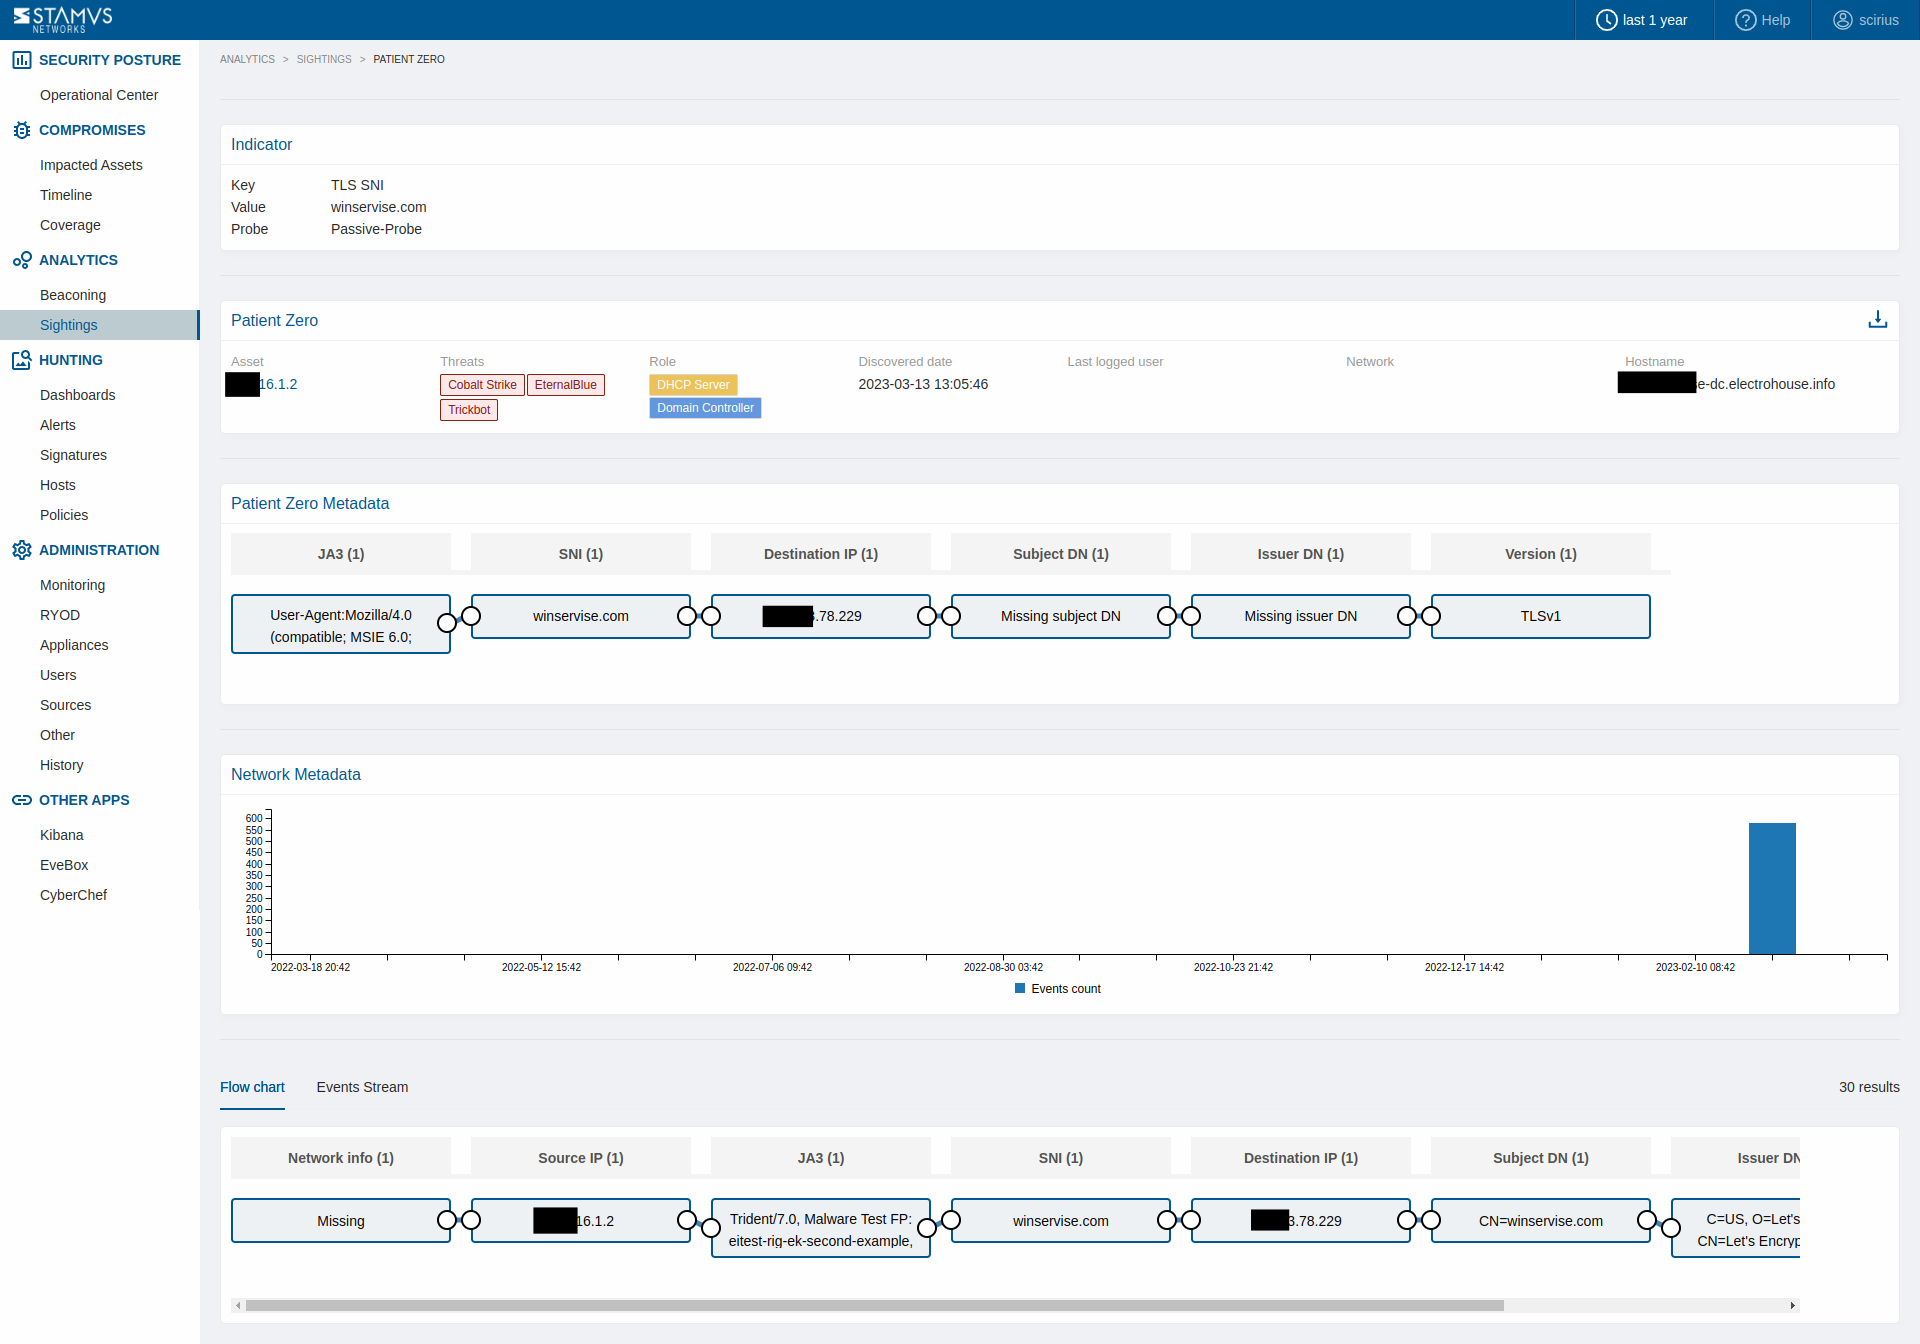
Sightings
Sightings detects new communication artifacts, never observed before in your environment, such as a HTTP User-Agent, a domain name, a JA3 hash, and so on.
The details page for each Sighting event will display:
The indicator observed (key/value pair)
The patient zero information (who generated this Sighting first)
The patient zero metadata (technical information related to this Sighting from patient zero)
The network metadata graph (a timeline of when this Sighting was observed)
The flow chart metadata visualization (all metadata from all hosts having contacted/used the same Sighting)
Sightings are really handy and powerful when performing combined analysis. For example, one could cross check Sightings with potential beacons, hence discovering beacons to a never observed before TLS SNI (domain) for example. Similarly, we could hunt downloaded executables from never seen before domain names. We can also utilise Sightings to show if there are any new internal or external HTTP servers in the environment, new TLS issuers seen on the production network or new executable transferred or accessed via SMB.
The currently observed artifacts are:
dns.query.rrname
http.hostname
tls.ja3s.hash
tls.ja3.hash
tls.sni
tls.subject
tls.serial
tls.issuerdn
http.http_user_agent
ssh.client.software_version
ssh.server.software_version
smb.filename (samba protocol, transferred or accessed)
http.server (newly discovered internal or external HTTP servers)
To enable Sightings, simply go under Probe Management, edit a Network Probe or a Template, and check the option Logging of newly discovered values under the tab Filters.
Important
Advanced users might want to enable/disable Sightings at the fields level, or add new fields to be monitored. This is technically possible, please contact support@stamus-networks.com for scoping and guidance.
Hint
Sightings can be used by Policies. One can create a suppression or an escalation policy.
For example, the usage of a new HTTP User-Agent on a Domain Controller is something that shouldn’t be often observed in an environment, except after system upgrades.
This example can be achieved using a Sighting event (a newly observed HTTP User-Agent) and a Network Definition (Domain Controller) for example.
Another example would be the presence of new HTTP internal or external servers. In general internal HTTP servers should not be expected to be seen in regular clients areas. To list any such occurrences simply switch off Event type Alerts in the Dashboards view under the Hunting menu. Then observe for Newly discovered HTTP server Signature events. It can be even more powerful when combined with a Network Definition and set up as an automated escalation.
Sightings and multiple probes
As of U38, the current Sightings logic is on a per probe basis. This means, if an artifact such as a domain name like microsoft.com is first observed by one probe, a second probe will not have this knowledge. As a consequence, the first time the very same domain will be observed by the second probe, a new Sighting event will be generated, resulting in a total of 2 Sightings events in the summary table, one per probe.
Training period
When enabled, Sightings may generate some noise depending on your environment. This is why it is recommended to wait a week or so before drilling down into Sightings events, the time for actual traffic artifacts to be observed and added to the Sighting cache.
Buffer size
Each field monitored, such as dns.query, http.host, ja3s.hash, etc, have a dedicated cache. This cache, to simplify, is of 1 million entries (some specific fields have a smaller cache size).
There is no notion of time or expiration in this cache. Once an entry is added to the cache, it is there forever. Entries don’t expire.
If you absolutely need to make expire an entry, please contact support@stamus-networks.com
Rebooting a Network Probes, or pushing a new ruleset, doesn’t flush the cache. The cache is reboot persistent. In the worst case, if a Network Probe is dysfunctional, one may lose a few hundreds of entries (but you probably will have other issues first!)
To see the current number of entries in your cache, simply go to the Hunting / Dashboard page, and only select Sightings (discard Alerts). The first card should show you the number of entries per field.
Hint
Stamus Central Server whitelists the most common domains such as windowsupdate.com and alike. Cloud providers, despite being common, are not whitelisted as they can also be used by adversaries.
Note
To tweak this cache size if your environment requires it, contact support@stamus-networks.com
Detection and automation
An actual example of hands on hunting, detection and automation process can be reviewed in detail here on our blog - Hunting for Lateral Executable Transfers
Signatures
In any default installation on top of other built-in detection mechanisms (like ML beacon detection, SIGHTINGS, Homoglyphs and other) any Stamus Networks Probe comes with over 100k+ signatures in addition to about 2-5 million IoCs that match on DNS domains, TLS certificates and HTTP hosts that can be enabled with the simple click of a button.
Variables
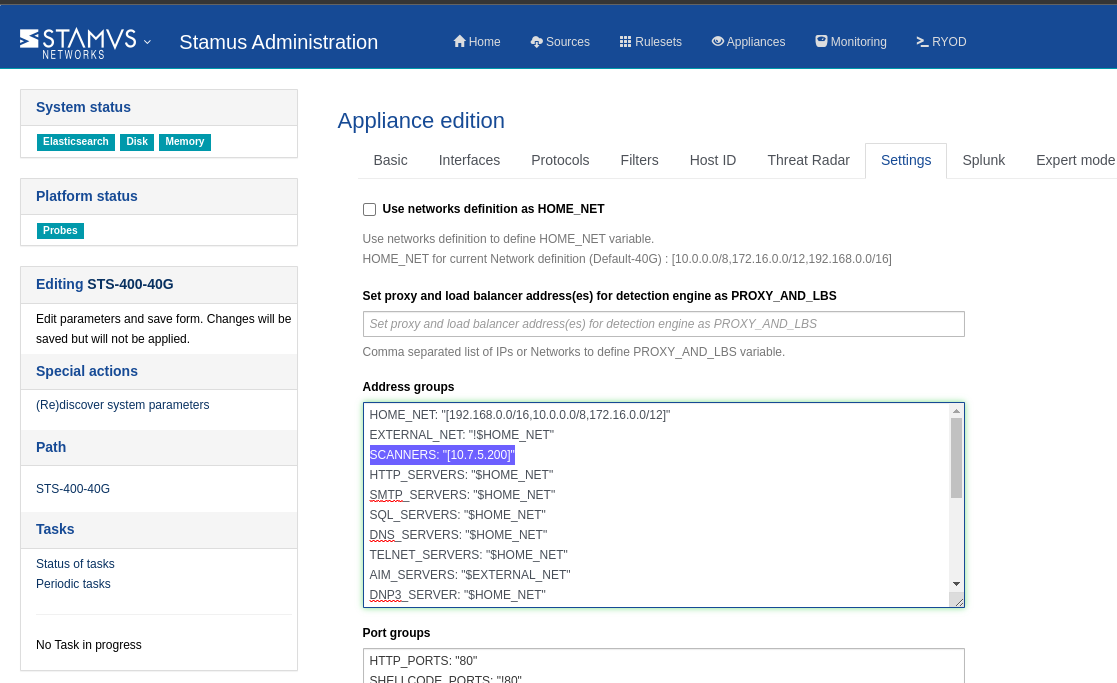
SCANNERS Variable
Different signature detection sets may require the admin to configure certain variables in the Stamus Network Probe Appliance settings.
This will depend upon the specific infrastructure of your organization.
One such configuration variable is SCANNERS. It should include IPs or networks of Vulnerability scanners, Infrastructure management servers (like SCCM), MS Terminal Servers and monitoring servers.
Note
It is highly recommended to use a correctly defined SCANNERS variable with the signature sets below.
To populate the variable, in the Administration menu, got to Appliances, select View on the respective appliance, click on Edit settings on the left hand side panel under Actions. Select the Settings tab, fill in the SCANNERS variable under neat the Address groups section.
Stamus signatures
This ruleset is enabled by default. This ruleset is specifically crafted by Stamus Networks to be used with Stamus appliances only and can not be utilised otherwise. Signatures: 25k+
Note
This is only available with Stamus NDR Licensing.
Proofpoint
This ruleset is enabled by default. Stamus Networks comes by default with Emerging threats PRO / PFPT Pro rulesest. Signatures: 65k+
Note
This is only available with Stamus NDR Licensing.
Lateral
This ruleset is not enabled by default.
This ruleset is developed by Stamus Networks specifically to highlight lateral movement in Windows environments. The purpose of this detection set is to audit, highlight and make possible escalation of unexpected or unwanted activity. The events produced have two distinctive metadata information additions in the log events themselves.
signature_severity Informational providing useful information in Incident response and audit analysis:
"metadata": {
    "stamus_classification": [
    "lateral"
    ],
    "lateral_function": [
    "LsarEnumerateTrustedDomains"
    ],
    "source": [
    "smb_lateral"
    ],
    "updated_at": [
    "2023_01_26"
    ],
    "provider": [
    "Stamus"
    ],
    "created_at": [
    "2022_04_02"
    ],
    "signature_severity": [
    "Informational"
    ],
    "lateral_asset": [
    "src_ip"
    ],
    "lateral_key": [
    "dcerpc.iface"
    ]
}
and signature_severity Critical that highlights an active configurational or service - change, create, edit, addition, removal etc.
"metadata": {
    "stamus_classification": [
    "lateral"
    ],
    "lateral_function": [
    "RCreateServiceW"
    ],
    "source": [
    "smb_lateral"
    ],
    "updated_at": [
    "2023_01_26"
    ],
    "provider": [
    "Stamus"
    ],
    "created_at": [
    "2022_03_23"
    ],
    "signature_severity": [
    "Critical"
    ],
    "lateral_asset": [
    "src_ip"
    ],
    "lateral_key": [
    "dcerpc.iface"
    ]
}
This ruleset requires the SCANNERS variable to be properly defined.
This ruleset is specifically crafted by Stamus Networks to be used with Stamus appliances only and can not be utilised otherwise.
Additional information about the open-source (non-commercial) version of this ruleset can be found in this blog post: Open Ruleset for Detecting Lateral Movement in Windows Environments with Suricata
To enable the Lateral signature detection set: from the Stamus Administration menu, click on the sources Sources tab, Add Public Source, choose the stamus/ssp-lateral set and enable it. Make sure you also select the current and/or desired ruleset for adding it in.
Lateral scan
This ruleset is not enabled by default.
This ruleset is developed by Stamus Networks specifically to highlight lateral movement via way of detecting lateral scanning. The purpose of this detection set is to highlight scanning activity not coming from the organization’s vulnerability scanners.
This ruleset requires the SCANNERS variable to be properly defined.
This ruleset is specifically crafted by Stamus Networks to be used with Stamus appliances only and can not be utilised otherwise.
To enable the Lateral scan signature detection set: from the Stamus Administration menu, click on the sources Sources tab, Add Public Source, choose the stamus/lateral-scan set and enable it. Make sure you also select the current and/or desired ruleset for adding it in.
Performance rulesest
This ruleset is not enabled by default.
This is a specific and curated ruleset designed to operate in ultra-hight performance, environments with minimal sacrifice to the breadth of threat detection. The ruleset is ideal for use in end user uncontrolled environments such as Internet service provider (ISP), university networks, hosting providers, etc. Please contact Stamus Networks support before adopting it.
To enable the Performance signature detection set: from the Stamus Administration menu, click on the sources Sources tab, Add Public Source, choose the stamus/performance set and enable it. Make sure you also select the current and/or desired ruleset for adding it in.
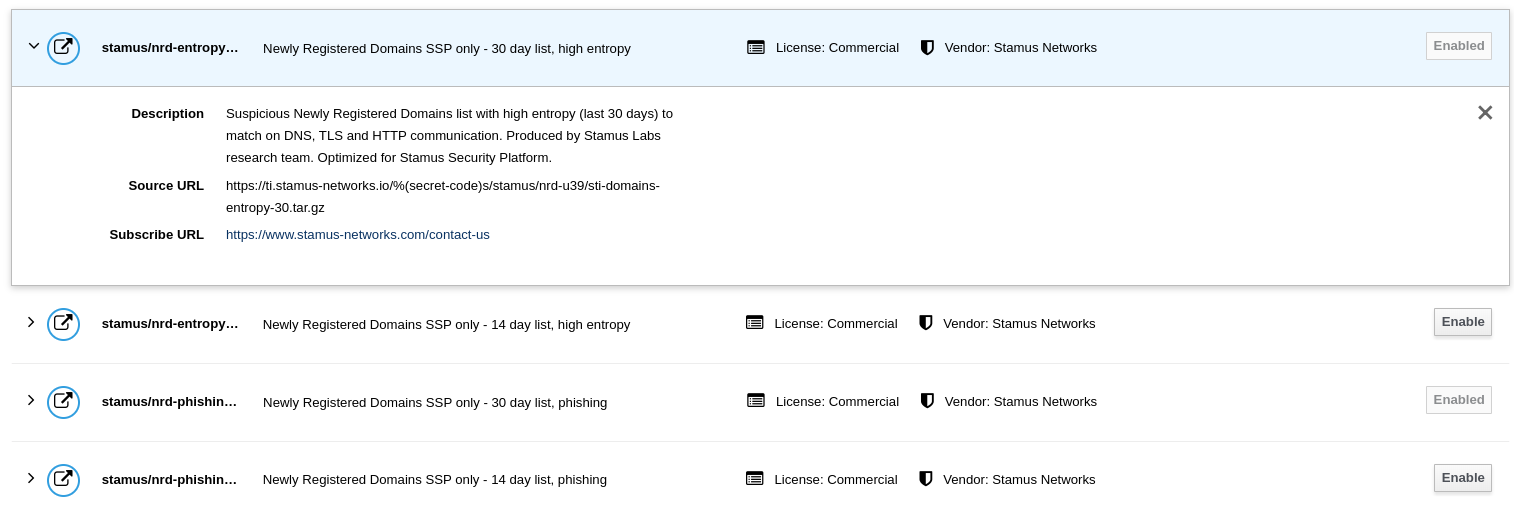
Newly Registered Domains (NRD)
With the introduction of Update 39 (U39), Stamus Networks began delivering six threat intelligence feeds focused on newly-registered domains to all Stamus Security Platform (SSP) users.
All NRD - A complete list of newly-registered domains. This set has between 5-12 million IoCs for a period of 30 days.
High Entropy NRDs - Newly-registered domains exhibiting high entropy, including those created by domain generation algorithms (DGAs). This set has between 3-8 million IoCs for a period of 30 days.
Phishing NRDs - Newly-registered domains that mimic popular domains, highly likely to be used in phishing campaigns. This set has between 5-200 thousand IoCs for a period of 30 days.
Those 3 main sources each have 2 time range variations (6 lists in total) - 14 and 30 days. For example, domains with high entropy are organized into 2 lists: a list that contains domains registered in the past 14 days and a list that contains domains registered in the last 30 days.
If your SSP detects DNS, TLS or HTTP communications containing a domain on the High Entropy NRDs or Phishing NRDs list, you would want to immediately investigate and check it out.
SSP detects communications with all variations of the NRD, including subdomain variations using the following protocol communication fields: dns.rrname, http.hostname and tls.sni
The All NRD list provides event logs that may be interesting to threat hunters due to the novelty of the domain - if, for example, we have a download from a NRD.
To enable the desired NRD list detection: from the Stamus Administration menu, click on the sources Sources tab, Add Public Source, choose which NRD list you would like, and enable it. Make sure you also select the current ruleset that would incorporate the NRDs.
Hint
Consider enabling High Entropy NRD and Phishing NRDs 30 days list with any deployment that is also monitoring internet (North-South) traffic.
Attention
On the smallest Stamus Networks HW probe models - SN-VA-100M (100 mbps virtual model) only the Phishing NRDs list should be enabled. For the rest of the High Entropy NRDs or All NRD there must be minimum of 2.4Gb or 3.6GB additional RAM respectively available.
Detection and automation examples
An actual example of hands on hunting, detection and automation process can be reviewed in detail here on our blog - Threat Hunting for Unknown Actors & Threats using NRD and Sightings
A detailed hands on example of incorporating NRD into Stamus Security Platform can be reviewed in the blog article - Incorporating Newly-Registered Domains into Stamus Security Platform Workflow
Anatomy of a detection event
Stamus Security Platform produces many different types of events based on the different types and algorithms of detection.
Application layer
Besides other information, any alert or network protocol event would have its own application layer section as part of the JSON log. A few examples shown below are based on HTTP, TLS, File transactions and SMB.
The example below provides application layer information on HTTP based alert ("event_type":"alert") or http event ("event_type":"http"):
"http": {
    "protocol": "HTTP/1.1",
    "server": "nginx",
    "http_request_body_printable": "t_9Ezrf_RP62sviiKMicKRZ7gOrMXCShom_Z6FaemXlQ2VslAC0KzRRJA-E1NHf8UbTBhgkPNkw",
    "url": "http://dfnzp2l2nmjrm.cloudfront.net/jquery-3.3.2.min.js?__cfduid=ZItYSly-bXtSvGt6",
    "http_method": "POST",
    "user_agent": {
        "os_major": "10",
        "device": "Other",
        "patch": "3987",
        "os_version": "10",
        "os_name": "Windows",
        "os": "Windows",
        "os_full": "Windows 10",
        "minor": "0",
        "name": "Chrome",
        "version": "80.0.3987.87",
        "major": "80"
    },
    "http_refer": "http://code.jquery.com/",
    "length": 5543,
    "http_refer_info": {
        "subdomain": "code",
        "scheme": "http",
        "tld": "com",
        "resource_path": "/",
        "url": "http://code.jquery.com/",
        "domain": "jquery.com",
        "host": "code.jquery.com",
        "domain_without_tld": "jquery"
    },
    "http_content_type": "application/javascript",
    "hostname": "dfnzp2l2nmjrm.cloudfront.net",
    "status": 200,
    "http_user_agent": "Mozilla/5.0 (Windows NT 10.0; Win64; x64) AppleWebKit/537.36 (KHTML, like Gecko) Chrome/80.0.3987.87 Safari/537.36",
    "http_response_body_printable": "obfuscated",
    "http_request_body": "obfuscated",
    "http_response_body": "obfuscated"
}
The example below provides application layer information on a file transaction based alert ("event_type":"alert") or a file transaction event ("event_type":"fileinfo") based on SMB(1/2/3), HTTP(2), FTP, SMTP, NFS protocols:
"files": [
    {
    "filename": "/",
    "magic": "ASCII text, with very long lines (956), with no line terminators",
    "gaps": false,
    "state": "CLOSED",
    "md5": "26b8bdfdd284aaf232837f7060ec30c1",
    "sha1": "03f74c435981774c779f8ec2edd7032b6d4bb391",
    "sha256": "2552a4f715eb93fcd38167428bc032e016084c8f23360532ab394c9d914b5010",
    "stored": false,
    "size": 5362,
    "tx_id": 1
    }
]
The example below provides application layer information on SMB based alert ("event_type":"alert") or SMB event ("event_type":"smb"), in this case - remotely scheduled task(tsch):
"smb": {
    "tree_id": 1,
    "command": "SMB2_COMMAND_IOCTL",
    "dcerpc": {
        "request": "REQUEST",
    "req": {
        "stub_data_size": 264,
        "frag_cnt": 1
    },
    "response": "UNREPLIED",
    "call_id": 2,
    "endpoint": "SASetAccountInformation",
    "opnum": 0,
    "interface": {
        "version": "1.0",
        "name": "sasec",
        "uuid": "378e52b0-c0a9-11cf-822d-00aa0051e40f"
    }
    },
    "ext_status": {
        "text": "STATUS_PENDING",
        "severity": "SUCCESS",
        "short_code": "0x103",
        "customer": 0,
        "facility": "UNDEFINED"
    },
    "id": 10,
    "session_id": 17607151321153,
    "status": "STATUS_PENDING",
    "status_code": "0x103",
    "dialect": "3.11"
}
The example below provides application layer information on TLS based alert ("event_type":"alert") or tls event ("event_type":"tls"):
"tls": {
    "cipher_security": "recommended",
    "ja3s": {
    "hash": "3653a20186a5b490426131a611e01992",
    "string": "771,52392,65281-0-11-35-16-23"
    },
    "cipher_suite": "TLS_ECDHE_RSA_WITH_CHACHA20_POLY1305_SHA256",
    "issuerdn": "C=US, O=Let's Encrypt, CN=R3",
    "ja3": {
    "hash": "079a675ceca1f8734937943fd4dd2caa",
    "string": "771,4867-4865-4866-52393-52392-49195-49199-49196-49200-49171-49172-156-157-47-53,0-16-27-13-5-23-17513-10-65281-45-11-18-51-35-43,29-23-24,0"
    },
    "notbefore": "2023-08-28T13:48:43",
    "notafter": "2023-11-26T13:48:42",
    "version": "TLS 1.2",
    "subject": "CN=02cscosgbuzl.top",
    "fingerprint": "3f:ac:d7:68:0c:b8:6d:db:b1:67:7f:90:a7:ee:6c:b0:1d:de:0a:11",
    "sni": "confirm.02cscosgbuzl.top",
    "serial": "03:5F:7E:0E:0D:03:EB:EE:9C:45:EB:F1:41:4A:1F:B3:D5:EB"
}
Flow_id
In each JSON event log produced by the detection engine, there will be a key present called flow_id. It has per flow unique value that allows to correlate the network protocol data and evidence logs of that flow - to an alert event and that alert’s metadata. flow_id is also present in non alerting flows/sessions and their respective logs.
"flow_id":1150967870383777
Flow section
Each alert event ("event_type":"alert") has a flow: section. In this section there is typical flow information at the time that the alert triggered. In that specific section there is also src_ip and dest_ip. Those represent what IP source started talking first on the network medium towards what destination IP. This can be different than the alerts source or destination IP which is relevant to the actual signature that triggered the alert. This flow section is also valid for the SIGHTINGS and Stamus events.
"flow":{
    "pkts_toclient":3
    "start":"2023-11-01T14:53:33.654215+0100"
    "src_ip":"10.7.1.101"
    "dest_ip":"72.21.91.29"
    "dest_port":80
    "bytes_toserver":734
    "pkts_toserver":4
    "bytes_toclient":815
    "src_port":49614
}
In the example above, the IP that initiated the connection is 10.7.1.101.
Note
This is different and not to be confused with ("event_type":"flow")
Metadata section (flowbits)
Each event type produced by the detection engine has a metadata section. This section represents the different markings/labels of a flow or record based on flowbits usage in the different signatures. One of the real benefits is, that it allows for streaming and continuous matching with flow labeling. This provides more context than simply correlating alerts to flows and protocol logs. These labels can be inserted into different flows and protocol transaction logs when producing the logs. This allows for much more elaborate detection logic based on queries in SIEMs.
"metadata":{
    "flowbits":[
        0:"smb.sambaclient"
        1:"ET.smb.binary"
        2:"ET.smbdcerpc.endians"
        3:"stamus.scmr.service.ROpenSCManagerW"
        4:"stamus.scmr.service.ROpenServiceW"
        5:"smb.servicecreate"
        6:"stamus.scmr.service.RCreateServiceW"
        7:"smb.servicestart"
        8:"stamus.scmr.service.RStartServiceW"
    ]
}
The example above is from a SMB based alert. The metadata fowbits will be present in every log produced from that flow - "event_type":"flow", "event_type":"alert" (if present), "event_type":"smb", "event_type":"fileinfo" or "event_type":"anomaly" (if present).
FQDN breakdown for HTTP, TLS and DNS
Every event based on application layer transactions from the following protocols: HTTP, TLS, DNS will also have the following (breakdown) enrichment added to its JSON log based on http hostname, tls sni and the dns query respectively - subdomain, tld, domain, host and domain_without_tld. Example:
"hostname_info":{
    "subdomain":"tss-geotrust-crl"
    "tld":"com"
    "url":"tss-geotrust-crl.thawte.com"
    "domain":"thawte.com"
    "host":"tss-geotrust-crl.thawte.com"
    "domain_without_tld":"thawte"
}
This enrichment will be present in the following event types: "event_type":"http", "event_type":"alert" (if present), "event_type":"http", "event_type":"tls".
Tagging and Classification
Any classified/tagged alert event ("event_type":"alert") will have its corresponding tag inserted in its JSON log. The tag values can be informational and relevant.
"tag":"relevant"
SMTP Enrichment
SMTP enrichment provides for embedded url/link analysis.
{
"has_exe_url": false,
"url": [
    "https://outlook.com/",
    "https://linkedin.com/",
    "https://facebook.com/",
    "https://amazon.com/"
],
"to": [
    "info@ledcenter.by"
],
"status": "PARSE_DONE",
"has_ipv4_url": false,
"has_ipv6_url": false,
"from": "oppong@expertsconsultgh.co"
}
The example enrichment above will be present where relevant in any SMTP based alert event ("event_type":"alert") or SMTP event ("event_type":"smtp").
Source and Target
The source and target information present in alert events ("event_type":"alert") can be used to tell which side of a flow triggering a signature is the target. If this key is present then related events are enhanced to contain the source and target of the attack. Example:
"source":{
    "net_info":[
        0:"Internet"
    ]
    "port":80
    "net_info_agg":"internet"
    "ip":"52.239.193.100"
}
"target":{
    "net_info":[
        0:"Private class A"
        1:"Internet"
    ]
    "port":49733
    "net_info_agg":"hq.2ndfloor.Site.Amsterdam"
    "ip":"10.5.7.101"
}
Organisational Context
If Network Definitions are configured, every event will have additional enrichment based on those definitions/organizational context. Example:
"net_info":{
    "src_agg":"hq-2ndfloor.clients.intranet"
        "dest":[
            0:"US"
            1:"PROD"
            2:"DC"
            3:"Intranet"
    ]
        "src":[
            0:"HQ-2ndfloor"
            1:"CLIENTS"
            2:"Intranet"
    ]
    "dest_agg":"us.prod.dc.intranet"
}
MAC address
Ethernet / MAC (Media Access Control) address enrichment is available as part of the standard JSON log of every event where available. Example:
"ether":{
    "src_mac":"58:97:bd:7a:71:40"
    "dest_mac":"70:ea:1a:28:fe:2d"
}
FQDN additions
If enabled, FQDN enrichment is available as part of the standard JSON log of every event. Example:
"fqdn": {
    "src": "fn-lmservice-63a.corp.com",
    "dest": "jksas1077.corp.com"
}
This allows to insert the FQDN resolved to its corresponding IP.
Discovery info
Every SIGHTINGS event from "event_type":"alert" will have a discovery subsection as part of the standard JSON log which shows the asset, asset’s role and the specific discovery key/value:
"discovery":{
"asset":"10.5.27.184"
    "asset_role":[]
"asset_net":"user.vyhar.org.affected-users"
"key":"smb.filename"
"value":"k.exe"
}
In the example above, the executable named k.exe was first seen transferred over SMB to 10.5.27.184.
GeoIP
Each event, wherever possible will have GeoIP enrichment subsection as part of the standard JSON log. Example:
"geoip": {
  "location": {
    "lon": 24.4167,
    "lat": 43.0167
  },
  "country": {
    "geoname_id": 732800,
    "name": "Bulgaria",
    "is_in_european_union": true,
    "iso_code": "BG"
  },
  "subdivisions": [
    {
      "geoname_id": 729560,
      "name": "Lovech",
      "iso_code": "11"
    }
  ],
  "provider": {
    "autonomous_system_number": 50360,
    "autonomous_system_organization": "Tamatiya EOOD"
  },
  "coordinate": [
    24.4167,
    43.0167
  ],
  "latitude": 43.0167,
  "continent": {
    "code": "EU",
    "geoname_id": 6255148,
    "name": "Europe"
  },
  "country_code3": "BG",
  "timezone": "Europe/Sofia",
  "city_name": "Sopot",
  "city": {
    "geoname_id": 726975,
    "name": "Sopot"
  },
  "postal": {
    "code": "5571"
  },
  "ip": "91.191.220.104",
  "country_code2": "BG",
  "continent_code": "EU",
  "country_name": "Bulgaria",
  "longitude": 24.4167,
  "registered_country": {
    "geoname_id": 732800,
    "name": "Bulgaria",
    "is_in_european_union": true,
    "iso_code": "BG"
  }
}
TLS Cipher analytics
Any TLS based alert or TLS protocol event (even TLS 1.3 with full encryption) will have Cipher analytics subsection as part of the standard JSON log. The following fields would be added cipher_security, cipher_suite Example:
{
"ja3": {
    "hash": "2201d8e006f8f005a6b415f61e677532",
    "string": "769,47-53-5-10-49171-49172-49161-49162-50-56-19-4,65281-0-5-10-11,23-24,0",
    "agent": [
    "MSIE 10.0 Trident/6.0, Malware Test FP: blackhole-ek-traffic, sweet-orange-ek-post-infection-traffic, sweet-orange-ek-traffic, styx-ek-traffic"
    ]
},
"sni": "1jskidelt2pg0238du.ohtheigh.cc",
"notbefore": "2013-05-14T19:32:22",
"cipher_suite": "TLS_RSA_WITH_AES_256_CBC_SHA",
"issuerdn": "C=GB, ST=Yorks, L=York, O=MyCompany Ltd., OU=IT, CN=localhost",
"notafter": "2014-05-14T19:32:22",
"cipher_security": "insecure",
"version": "TLSv1",
"serial": "00:C5:A4:39:20:05:58:D6:82",
"subject": "C=GB, ST=Yorks, L=York, O=MyCompany Ltd., OU=IT, CN=localhost",
"ja3s": {
    "hash": "91589ea825a2ee41810c85fab06d2ef6",
    "string": "769,53,65281"
},
"fingerprint": "90:5e:f2:18:82:ba:67:b4:44:5a:3c:c2:51:3c:6c:36:66:40:b1:23"
}
This enrichment will be present in the following event types: SIGHTINGS, "event_type":"alert" if TLS based and "event_type":"tls".
TLS JA4
Any TLS based alert or TLS protocol event (even TLS 1.3 with full encryption) will have TLS JA4 subsection as part of the standard JSON log. The following fields would be added ja4.hash, ja4.agent Example:
"tls": {
  "subject": "C=US, ST=California, L=Mountain View, O=Google LLC, CN=*.googleapis.com",
  "issuerdn": "C=US, O=Google Trust Services, CN=Google Internet Authority G3",
  "serial": "17:E1:46:B0:38:54:10:79:F3:BB:60:C1:C3:B7:9A:C7",
  "fingerprint": "c6:3e:93:ab:25:2b:06:11:2f:f9:d3:61:fb:2e:89:28:91:2c:27:46",
  "sni": "www.googleapis.com",
  "version": "TLS 1.2",
  "notbefore": "2019-06-11T12:22:17",
  "notafter": "2019-09-03T12:20:00",
  "ja3": {
    "hash": "bc6c386f480ee97b9d9e52d472b772d8",
    "string": "771,49195-49199-49196-49200-52393-52392-49171-49172-156-157-47-53-10,65281-0-23-35-13-5-18-16-11-10,29-23-24,0",
    "agent": [
      "Chrome Version 60/61.0.3163, Google Chrome"
    ]
  },
  "ja4": {
    "hash": "t12d1310h2_8b80da21ef18_e69ac49eb88f",
    "agent": [
      "Chrome Version 60/61.0.3163, Google Chrome"
    ]
  },
  "ja3s": {
    "hash": "06dc1d6aa358d0a305c7d6ce6b132be5",
    "string": "771,49195,23-65281-11-35-16-18"
  },
  "alpn_ts": [
    "h2",
    "http/1.1"
  ],
  "alpn_tc": "h2",
  "cipher_suite": "TLS_ECDHE_ECDSA_WITH_AES_128_GCM_SHA256",
  "cipher_security": "recommended"
}
This enrichment will be present in the following event types: SIGHTINGS, "event_type":"alert" if TLS based, "event_type":"flow" if TLS based and "event_type":"tls".
TLS ALPN
Any TLS based alert or TLS protocol event (even TLS 1.3 with full encryption) will have TLS JA4 subsection as part of the standard JSON log. The following fields would be added ja4.alpn_tc, ja4.alpn_ts Example:
"tls": {
  "subject": "C=US, ST=California, L=Mountain View, O=Google LLC, CN=*.googleapis.com",
  "issuerdn": "C=US, O=Google Trust Services, CN=Google Internet Authority G3",
  "serial": "17:E1:46:B0:38:54:10:79:F3:BB:60:C1:C3:B7:9A:C7",
  "fingerprint": "c6:3e:93:ab:25:2b:06:11:2f:f9:d3:61:fb:2e:89:28:91:2c:27:46",
  "sni": "www.googleapis.com",
  "version": "TLS 1.2",
  "notbefore": "2019-06-11T12:22:17",
  "notafter": "2019-09-03T12:20:00",
  "ja3": {
    "hash": "bc6c386f480ee97b9d9e52d472b772d8",
    "string": "771,49195-49199-49196-49200-52393-52392-49171-49172-156-157-47-53-10,65281-0-23-35-13-5-18-16-11-10,29-23-24,0",
    "agent": [
      "Chrome Version 60/61.0.3163, Google Chrome"
    ]
  },
  "ja4": {
    "hash": "t12d1310h2_8b80da21ef18_e69ac49eb88f",
    "agent": [
      "Chrome Version 60/61.0.3163, Google Chrome"
    ]
  },
  "ja3s": {
    "hash": "06dc1d6aa358d0a305c7d6ce6b132be5",
    "string": "771,49195,23-65281-11-35-16-18"
  },
  "alpn_ts": [
    "h2",
    "http/1.1"
  ],
  "alpn_tc": "h2",
  "cipher_suite": "TLS_ECDHE_ECDSA_WITH_AES_128_GCM_SHA256",
  "cipher_security": "recommended"
}
This enrichment will be present in the following event types: SIGHTINGS, "event_type":"alert" if TLS based, "event_type":"flow" if TLS based and "event_type":"tls".
DCERPC function name mappings
Any DCERPC event will have enrichment in the form of a name mapping subsection as part of the standard JSON log. In the example below the uuid is translated to name: sasec which is translating Microsoft’s uuid to its name. Example:
"smb": {
  "command": "SMB2_COMMAND_WRITE",
  "status_code": "0x0",
  "id": 8,
  "tree_id": 1,
  "dcerpc": {
    "request": "BIND",
    "response": "BINDACK",
    "call_id": 2,
    "interfaces": [
      {
        "version": "1.0",
        "ack_result": 2,
        "ack_reason": 0,
        "name": "sasec",
        "uuid": "378e52b0-c0a9-11cf-822d-00aa0051e40f"
      },
      {
        "version": "1.0",
        "ack_result": 0,
        "ack_reason": 0,
        "name": "sasec",
        "uuid": "378e52b0-c0a9-11cf-822d-00aa0051e40f"
      },
      {
        "version": "1.0",
        "ack_result": 3,
        "ack_reason": 0,
        "name": "sasec",
        "uuid": "378e52b0-c0a9-11cf-822d-00aa0051e40f"
      }
    ]
  }
The following event types will have that enrichment "event_type":"alert" (where relevant), "event_type":"smb" and "event_type":"dcerpc".
Number of transactions in a flow
Any protocol event will have enrichment in the form tx_id as part of the standard JSON log. This allows to tell how many transactions are there in that specific session. In turn it allows for query based searches covering use cases such as too many ACCESS DENIED transactions in the same SMB flow/session which is an indicator for brute forcing. Example:
"tx_id": 650,
"smb": {
  "share_type": "UNKNOWN",
  "command": "SMB2_COMMAND_TREE_CONNECT",
  "status_code": "0xc0000022",
  "id": 66,
  "tree_id": 0,
  "share": "\\\\share.network\\candy$",
  "ext_status": {
    "text": "STATUS_ACCESS_DENIED",
    "facility": "UNDEFINED",
    "customer": 0,
    "short_code": "0x22",
    "severity": "ERROR"
  },
  "status": "STATUS_ACCESS_DENIED",
  "dialect": "3.11",
  "session_id": 1703757132
}
Any event type would have that field.
SSH hassh, client and server software
Any SSH protocol event will have by default the ssh client and server software and version as part of its log. Further more the event will contain a unique hash of both the client and server side hassh allowing for further analytics and uniquely identifying ssh communications and flows. Example:
"ssh": {
  "client": {
    "software_version": "libssh_0.7.4",
    "proto_version": "2.0",
    "hassh": {
      "string": "curve25519-sha256@libssh.org,ecdh-sha2-nistp256,diffie-hellman-group14-sha1,diffie-hellman-group1-sha1;aes256-ctr,aes192-ctr,aes128-ctr,aes256-cbc,aes192-cbc,aes128-cbc,3des-cbc;hmac-sha2-256,hmac-sha2-512,hmac-sha1;none",
      "hash": "e37f354a101aff5871ba233aa82b84ec"
    }
  },
  "server": {
    "software_version": "OpenSSH_7.4",
    "proto_version": "2.0",
    "hassh": {
      "string": "curve25519-sha256,curve25519-sha256@libssh.org,ecdh-sha2-nistp256,ecdh-sha2-nistp384,ecdh-sha2-nistp521,diffie-hellman-group-exchange-sha256,diffie-hellman-group16-sha512,diffie-hellman-group18-sha512,diffie-hellman-group-exchange-sha1,diffie-hellman-group14-sha256,diffie-hellman-group14-sha1,diffie-hellman-group1-sha1;chacha20-poly1305@openssh.com,aes128-ctr,aes192-ctr,aes256-ctr,aes128-gcm@openssh.com,aes256-gcm@openssh.com,aes128-cbc,aes192-cbc,aes256-cbc,blowfish-cbc,cast128-cbc,3des-cbc;umac-64-etm@openssh.com,umac-128-etm@openssh.com,hmac-sha2-256-etm@openssh.com,hmac-sha2-512-etm@openssh.com,hmac-sha1-etm@openssh.com,umac-64@openssh.com,umac-128@openssh.com,hmac-sha2-256,hmac-sha2-512,hmac-sha1;none,zlib@openssh.com",
      "hash": "6832f1ce43d4397c2c0a3e2f8c94334e"
    }
  }
}
The following event types will have that enrichment "event_type":"ssh".
Additional resources
Further reading and ideas around the data analytics topic can be found in our free book, Suricata for Analysts the world’s first practical guide to threat detection and hunting using Suricata.