
Warning: You are viewing an older version of this documentation. Most recent is here: 42.2.0
Global Configuration
HTTPS
You can use a custom HTTPS certificate and key for the connection with the web UI. In order to enable the HTTPS setting, you have to:
go to
Appliances Global Settingsby clicking on Stamus Networks drop-down menu in the SCS Management appgo to
HTTPStabenable the
Use a custom HTTPS certificate and keycheckboxIn the
Ssl cipherstext box, you can list the combination of encryption algorithms that are used to secure the communication between the client (e.g., web browser) and the server (e.g., web server) over an HTTPS connection.
Note
Here’s an example of what HIGH+ECDHE+AESGCM in the Ssl ciphers input box represents: HIGH: This specifies that ciphers with high encryption strength should be used. ECDHE: This refers to the elliptic curve Diffie-Hellman key exchange algorithm, which is used to generate a shared secret between the client and server that is used to encrypt the data. AESGCM: This refers to the Advanced Encryption Standard (AES) in Galois/Counter Mode (GCM), which is a block cipher mode of operation that provides authenticated encryption.
upload you TLS key under
TLS key for accessing web interfaceupload you Certificate under
TLS certificate for accessing web interfaceclick on
Applybutton and Apply changes on your SCS
Log retention
Select Global Appliance Settings from the drop down menu on the left upper side corner (Stamus Networks logo).
Click on the Log retention tab change the retention period (in days) to a desired one. You can also custom choose a log retention on a per log type basis:
Alert
DNS
HTTP
Modbus
SMTP
SSH
System
TLS
File info
Netflow
Note
To clear the logs history, click on Appliances major menu, select Global Appliance Settings from the drop down menu on the left upper side corner(Stamus Networks logo).
Click on the Log retention tab and click Clean old logs now.
Database status and health
Click on Home major menu -> click on Elasticsearch under System status from the left hand side. You will be presented with an in depth view of the data cluster including -
version, status, shards and file systems info/size etc.
Forwarding Events (output plugin)
It is possible to forward events generated by the probes via the following protocols:
Lumberjack: TLS encrypted, fault tolerant protocol
Logstash TCP: unencrypted protocol
Note
You can also forward alerts via email. For more information on how to configure and use this feature, please see Sending Emails
To enable events forwarding, select Global Appliance Settings from the drop down menu on the left upper side corner (Stamus Networks logo).
Click on the Output plugin tab.
To activate logstash TCP, click on active below TCP output and set the hostname and port.
To activate Lumberjack protocol, click on active below Lumberjack output and set the hostname and port. You also
need to upload a TLS certificate under PEM format. It must allow SCS to verif the TLS connection to the Lumberjack server.
In order for the changes to become active you need to apply (or schedule) the changes. Click Apply changes
under Action on the left hand side menu, select and schedule or apply directly for Stamus Central Server.
If you want to send events to a Logstash daemon via Lumberjack you can run use the following configuration:
input {
   lumberjack {
      port => 5044
      ssl_certificate => "/etc/logstash/cert.pem"
      ssl_key => "/etc/logstash/cert.key"
      codec => "json"
   }
}
If you want to use Logstash TCP, then your remote configuration has to be like:
input {
   tcp {
      codec => "json_lines"
      port => 8000
   }
}
Sending Emails
In order to enable forwarding/receiving alerts via email, you first need to enable the feature. To do this:
Go to
Appliances Global Settingsfrom Stamus Networks drop-down menu onManagementapp;Go to
Output plugintab;Go to
Email outputand enable the Active checkbox;Configure the rest of the settings (port, authentication, etc.), according to your email server;
Do an
Apply changeson Stamus Central Server
To be able to start forwarding/receiving alerts, you need to create a Send email action. To do this:
Go to
Huntingapp;Select an alert you would like to forward via email, by applying a filter on it’s alert.signature_id;
Click on
Policy actionsdrop-down and select Send email action;Choose Maximum number of mail sent per day and select the desired Ruleset;
Submit your Policy action and do an
Update/push ruleseton Probe
Once done, you will start forwarding/receiving emails for the desired alert you have selected previously.
NTP
To configure a NTP server from which the time will be synchronized from, login on SCS and go under Appliances Global Settings from the Stamus Logo dropdown menu and select the NTP tab.
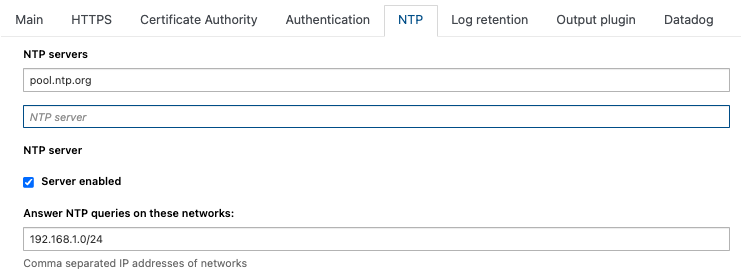
Here, the server used is pool.ntp.org and can be changed to fit your needs. Once set, this setting will synchronize the clock of the SCS.
To synchronise the Network Probes, check the box Server enable to activate a NTP server on SCS. Once checked, set the list of subnets that will be allowed to synchronize with this NTP server, for example 10.44.1.0/24,192.168.1.0/24.
Once the NTP server is activated on SCS, connect to each probes over SSH to update the NTP server to use using sudo stamus_config and point to the SCS IP address.
Stamus Probe Global Parameters
Change name of a probe
Click on Appliances major menu -> Select the desired probe - as available under name form the Stamus Probes list. Click on sub menu Edit under Action form the
left hand side panel. Click on subsection Basic. Make the needed changes for the remote probe and then click on Submit.
Click on
Apply change(s) under the sub menu Pending modification(s) from the left hand side panel. Choose if you would like to schedule the change or apply immediately.
Click on the Apply button. In the task list presented - you will be informed of the details of the task execution - status, duration, started, retries etc.
Note
Changing the name will cause already existing log to be dissociated from the actual probe.
Change description of a probe
Click on Appliances major menu -> Select the desired probe - as available under name form the Stamus Probes list. Click on sub menu Edit under Action form the
left hand side panel. Click on subsection Basic. Make the needed changes for the remote probe and then click on Submit.
Click on
Apply change(s) under the sub menu Pending modification(s) from the left hand side panel. Choose if you would like to schedule the change or apply immediately.
Click on the Apply button. In the task list presented - you will be informed of the details of the task execution - status, duration, started, retries etc.
Change ruleset of a probe
Click on Appliances major menu -> Select the desired probe - as available under name form the Stamus Probes list. Click on sub menu Edit under Action form the
left hand side panel. Click on subsection Basic. Click select the ruleset from the drop down menu the for the remote probe and then click on Submit.
Click on
Apply change(s) under the sub menu Pending modification(s) from the left hand side panel. Choose if you would like to schedule the change or apply immediately.
Click on the Apply button. In the task list presented - you will be informed of the details of the task execution - status, duration, started, retries etc.
Change management IP address of a probe
Click on Appliances major menu -> Select the desired probe - as available under name form the Stamus Probes list. Click on sub menu Edit under Action form the
left hand side panel. Click on subsection Basic. Change the IP address for the remote probe and then click on Submit.
Click on
Apply change(s) under the sub menu Pending modification(s) from the left hand side panel. Choose if you would like to schedule the change or apply immediately.
Click on the Apply button. In the task list presented - you will be informed of the details of the task execution - status, duration, started, retries etc.
Edit inspection networks and ports for a probe
Click on Appliances major menu -> Select the desired probe - as available under name form the Stamus Probes list. Click on sub menu Edit under Action form the
left hand side panel. Click on subsection Settings. Make the needed changes in the Address groups or Port groups sections. Click on Submit.
Click on
Apply change(s) under the sub menu Pending modification(s) from the left hand side panel. Choose if you would like to schedule the change or apply immediately.
Click on the Apply button. In the task list presented - you will be informed of the details of the task execution - status, duration, started, retries etc.
Rediscover system parameters
In case of hardware changes on a probe, you can click on (Re)discover system parameters under Special actions sub menu from the left hand side panel to rediscover the appliances hardware parameters.
Expert configuration
Custom and expert configuration for a probe - YAML include
Click on Appliances major menu -> Select the desired probe - as available under name form the Stamus Probes list. Click on sub menu Edit under Action form the
left hand side panel. Click on subsection Expert Mode.In the YAML to include in suricata configuration window -> paste or write the YAML specific change you would like to include.
You do not need to do that for the whole YAML - just for the section that you want/need to adjust/change. Example:
flow:
    memcap: 64mb
    hash-size: 65536
    prealloc: 10000
    emergency-recovery: 30
    #managers: 1 # default to one flow manager
    #recyclers: 1 # default to one flow recycler thread
Note
Make sure the change conforms to the YAML language code of writing otherwise the change will fail.
Click on Submit. Click on Apply change(s) under the sub menu Pending modification(s) from the left hand side panel. Choose if you would like to schedule the change or apply immediately.
Click on the Apply button. In the task list presented - you will be informed of the details of the task execution - status, duration, started, retries etc.
Custom suricata runtime flags
Important
It is highly recommended and advised for any expert configurational changes to be reviewed and approved by Stamus Networks as there can be performance and/or detection impact.
On the same Expert mode section, as mentioned before, you can configure dedicated runtime flags to be passed to Suricata in Add more suricata flags.
You can find the documentation for the offical command line flags at Command line options.
One common option is to override one specific config setting, instead of replacing a whole section of the YAML configuration.
For example if you would like to increase the limit of signatures, that are included in the rule profiling statistics (default: 10), you can pass the following flag:
--set profiling.rules.limit=100
Note
This value has an impact on how many signatures are seen in the SN-SIGNATURE-Performance Dashboard in Kibana
Click on Submit. Click on Apply change(s) under the sub menu Pending modification(s) from the left hand side panel. Choose if you would like to schedule the change or apply immediately.
Click on the Apply button. In the task list presented - you will be informed of the details of the task execution - status, duration, started, retries etc.