Warning: You are viewing an older version of this documentation. Most recent is here: 42.2.0
Analyzing Compromises
Declaration of Compromise®
Definition
A Declaration of Compromise® is the high-fidelity security incident event in Clear NDR®. Examples may include the observation of malware, lateral movement, or advanced persistent threats (APTs) associated with a specific asset (e.g. host) in the network.
Powerful Security Alert Noise Reduction
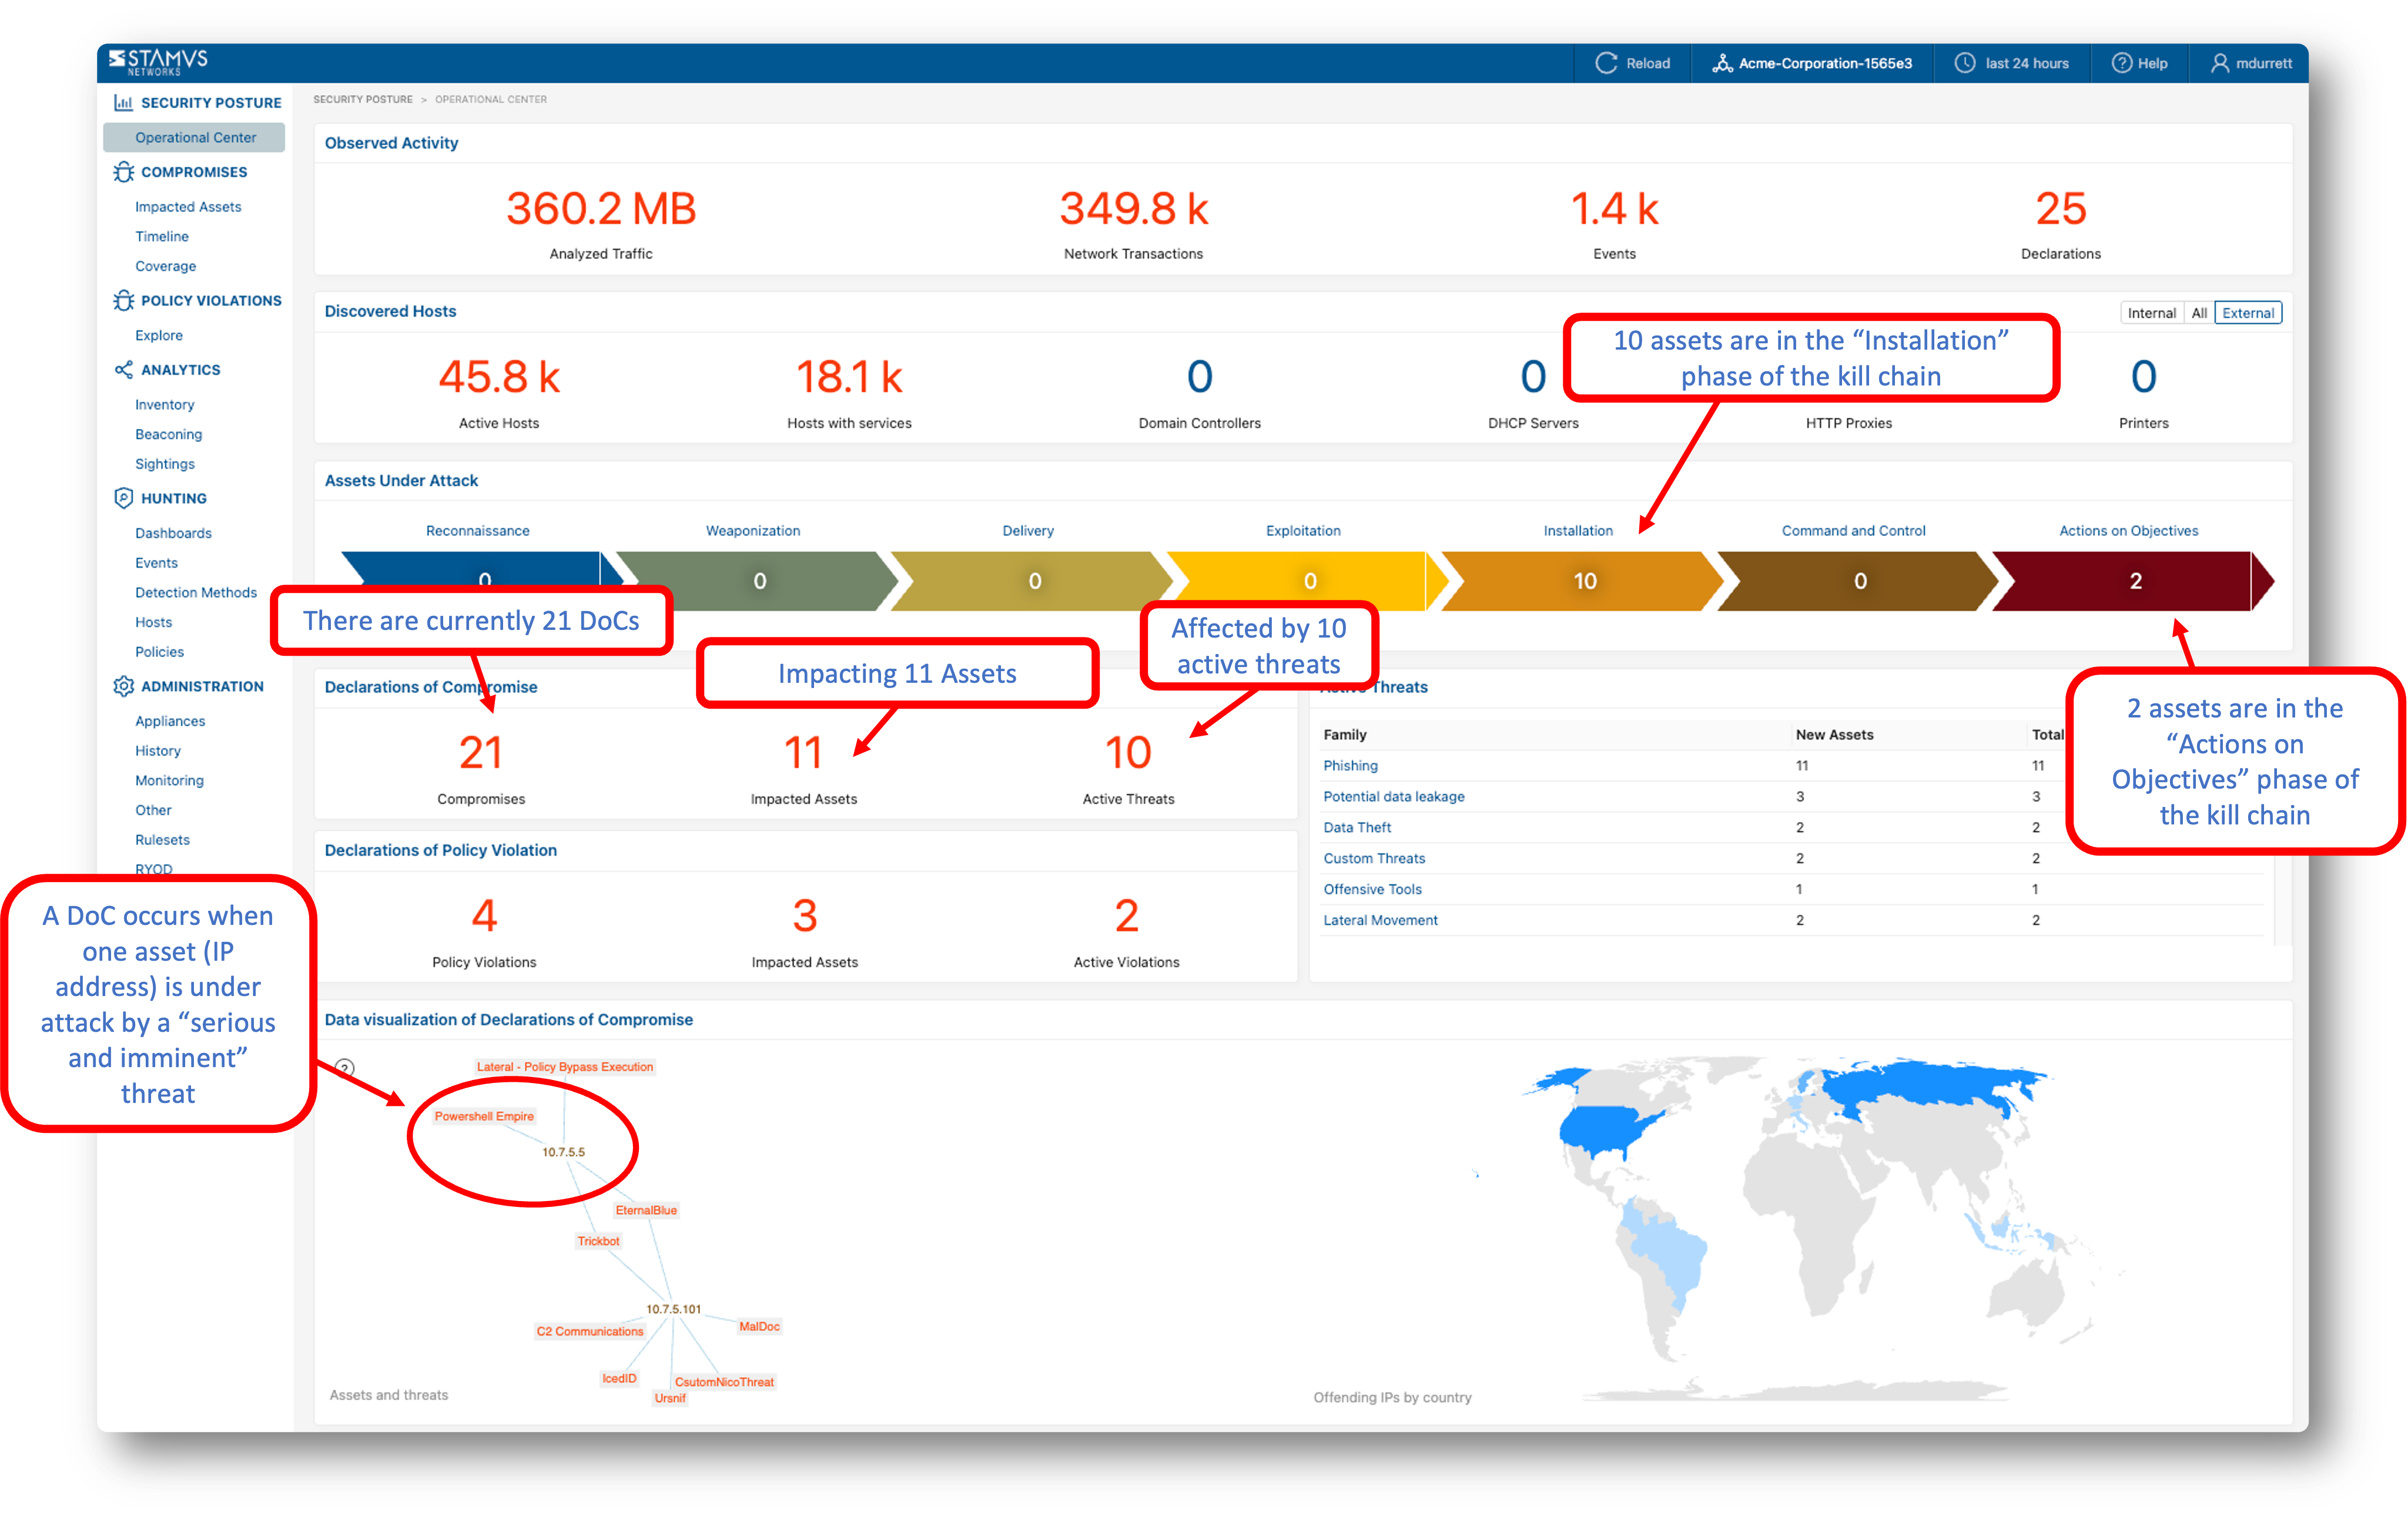
The power of the DoC is that it gives security personnel a clear starting point for what is important and worthy of investigation. The diagram below illustrates this concept more clearly for a typical deployment of Clear NDR® monitoring a 10 Gbps network connection.
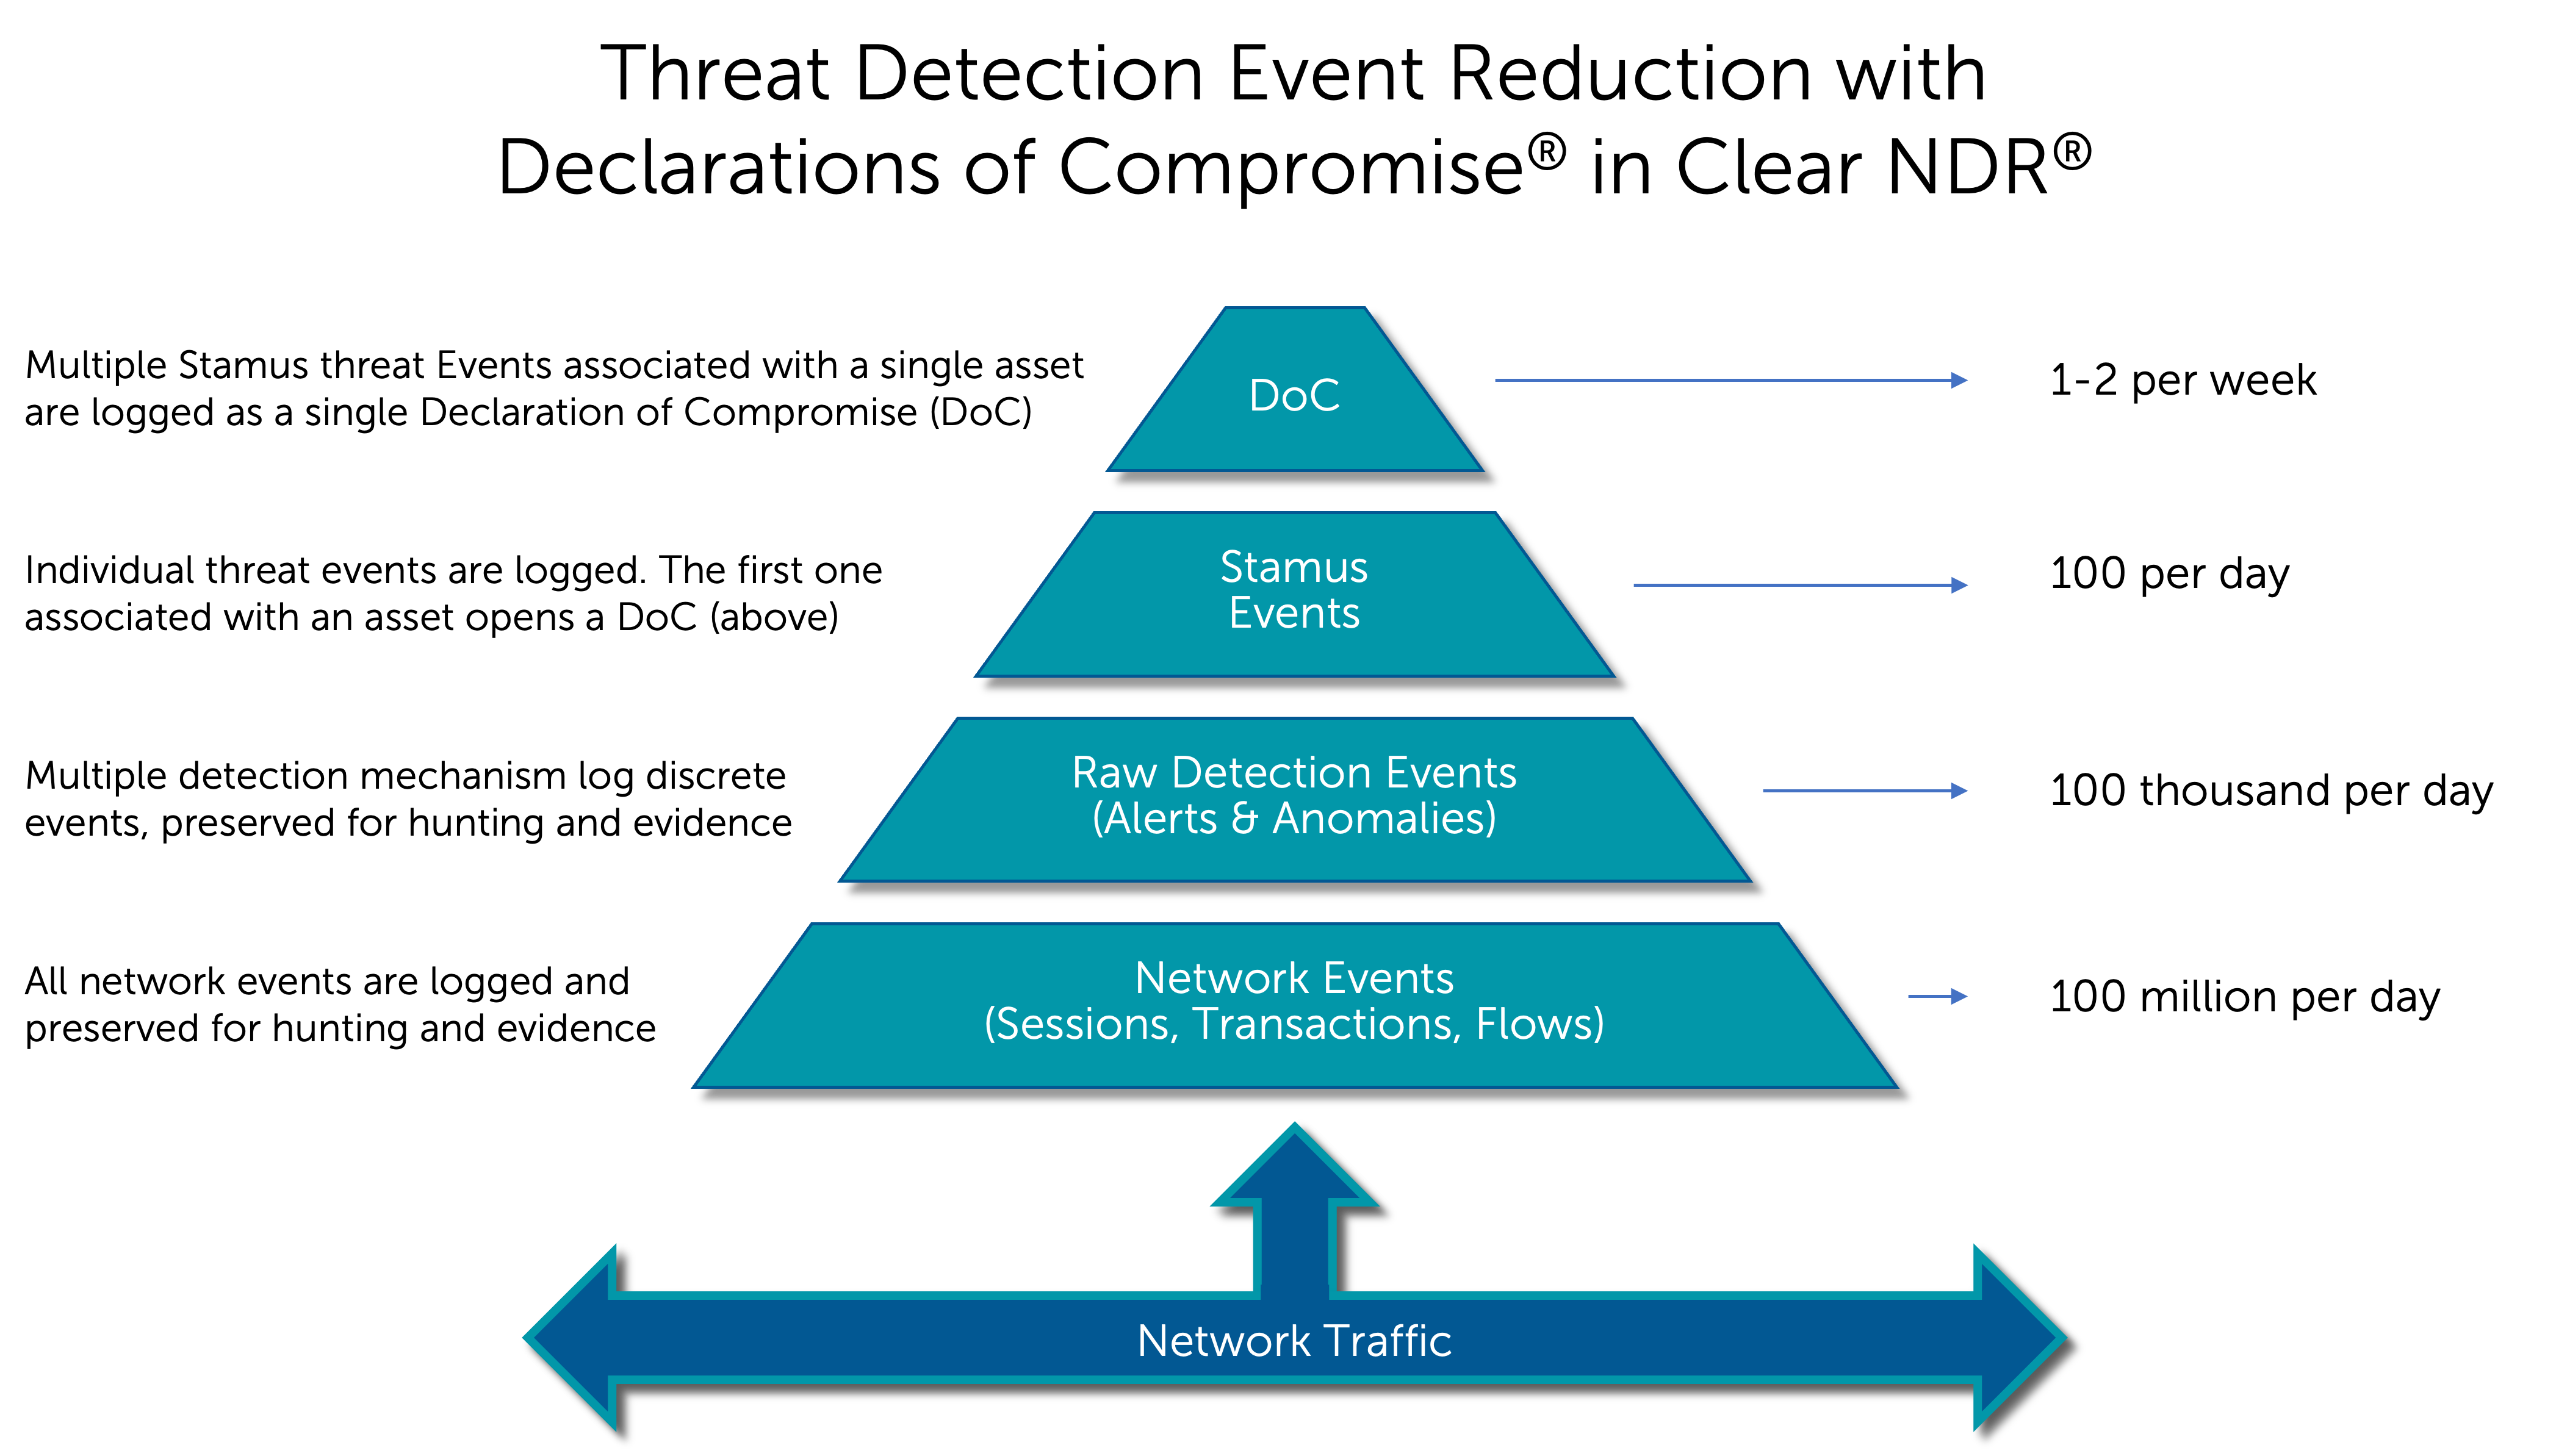
You can see that, while Clear NDR® collects extensive network metadata and discrete threat detections, it simplifies the incident responder’s job by identifying the most serious and imminent and true positive threat events – those that represent a true compromise to the organization, issuing a confident ‘declaration’ of compromise.
The Anatomy of a DoC
The high-fidelity threat detection algorithms in Clear NDR® are called detection methods or simply methods. Most can be associated with threat families and named threats. See the diagram below:
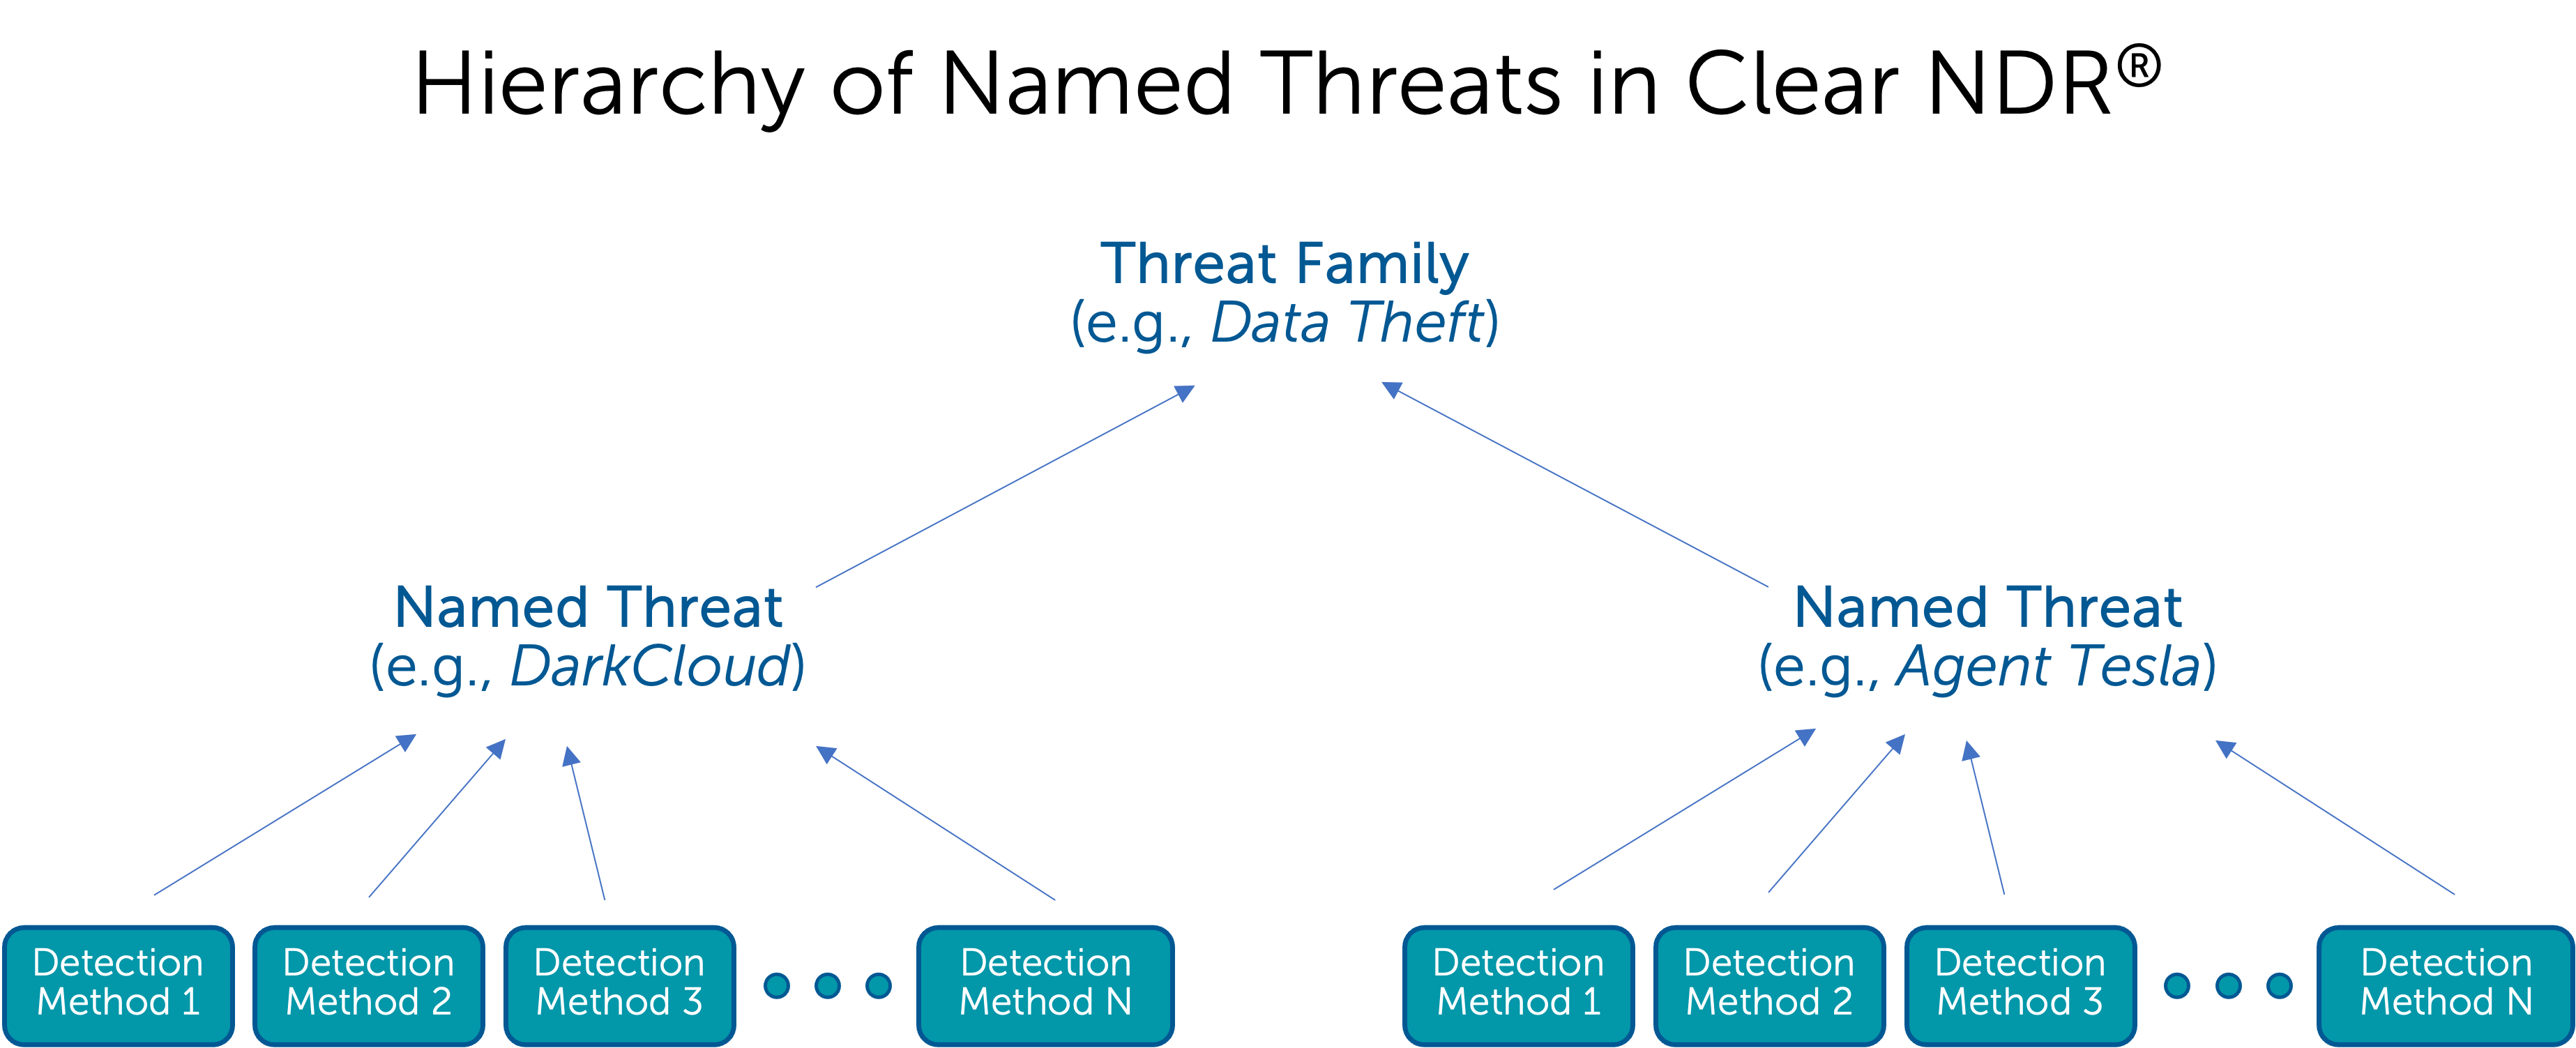
These detection methods can initiate a DoC or DoPV incident and are designed to trigger only under conditions of an active incident. These individual high-fidelity detection events are logged in Clear NDR® Probe, and they are called Stamus Events in the user interface and Stamus Events in the API.
A DoC event is created when the first Stamus Event is logged against an asset, such as a HOST or USER. DoC events are created in Clear NDR® Central Server.
Subsequent occurrences of Stamus Events for the same Named Threat on the same asset are logged, but they do not trigger a new DoC.
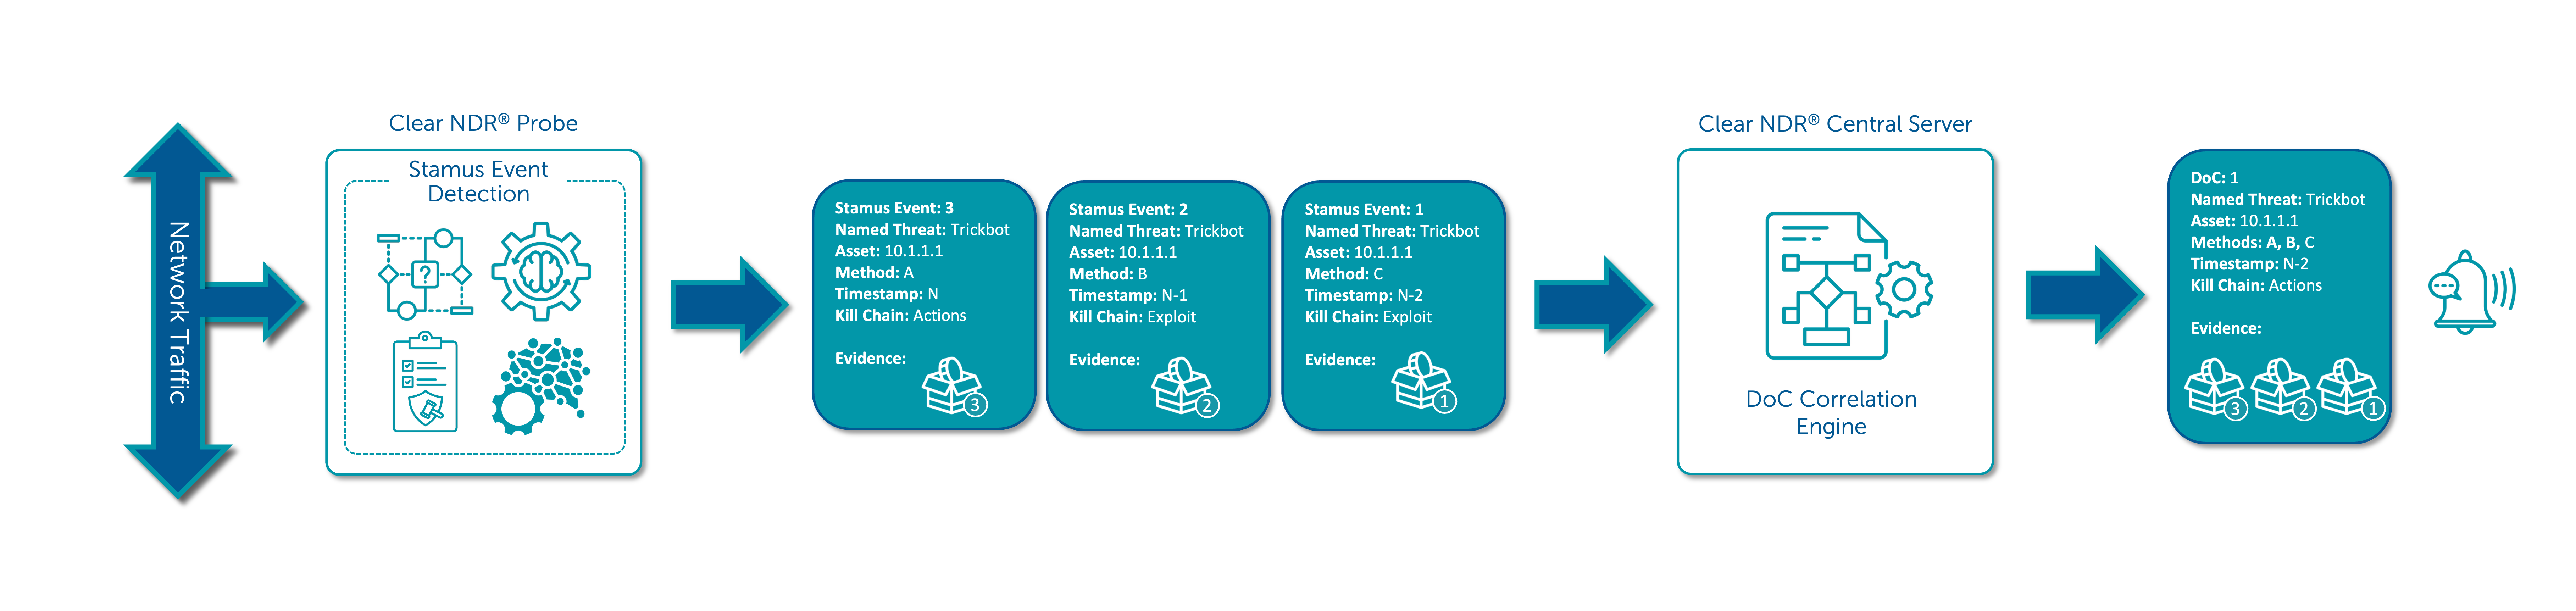
Each specific named threat is associated with a phase of the cyber security kill chain. And the kill chain phase of the asset is determined by the kill chain phase of the threat which is attacking it.
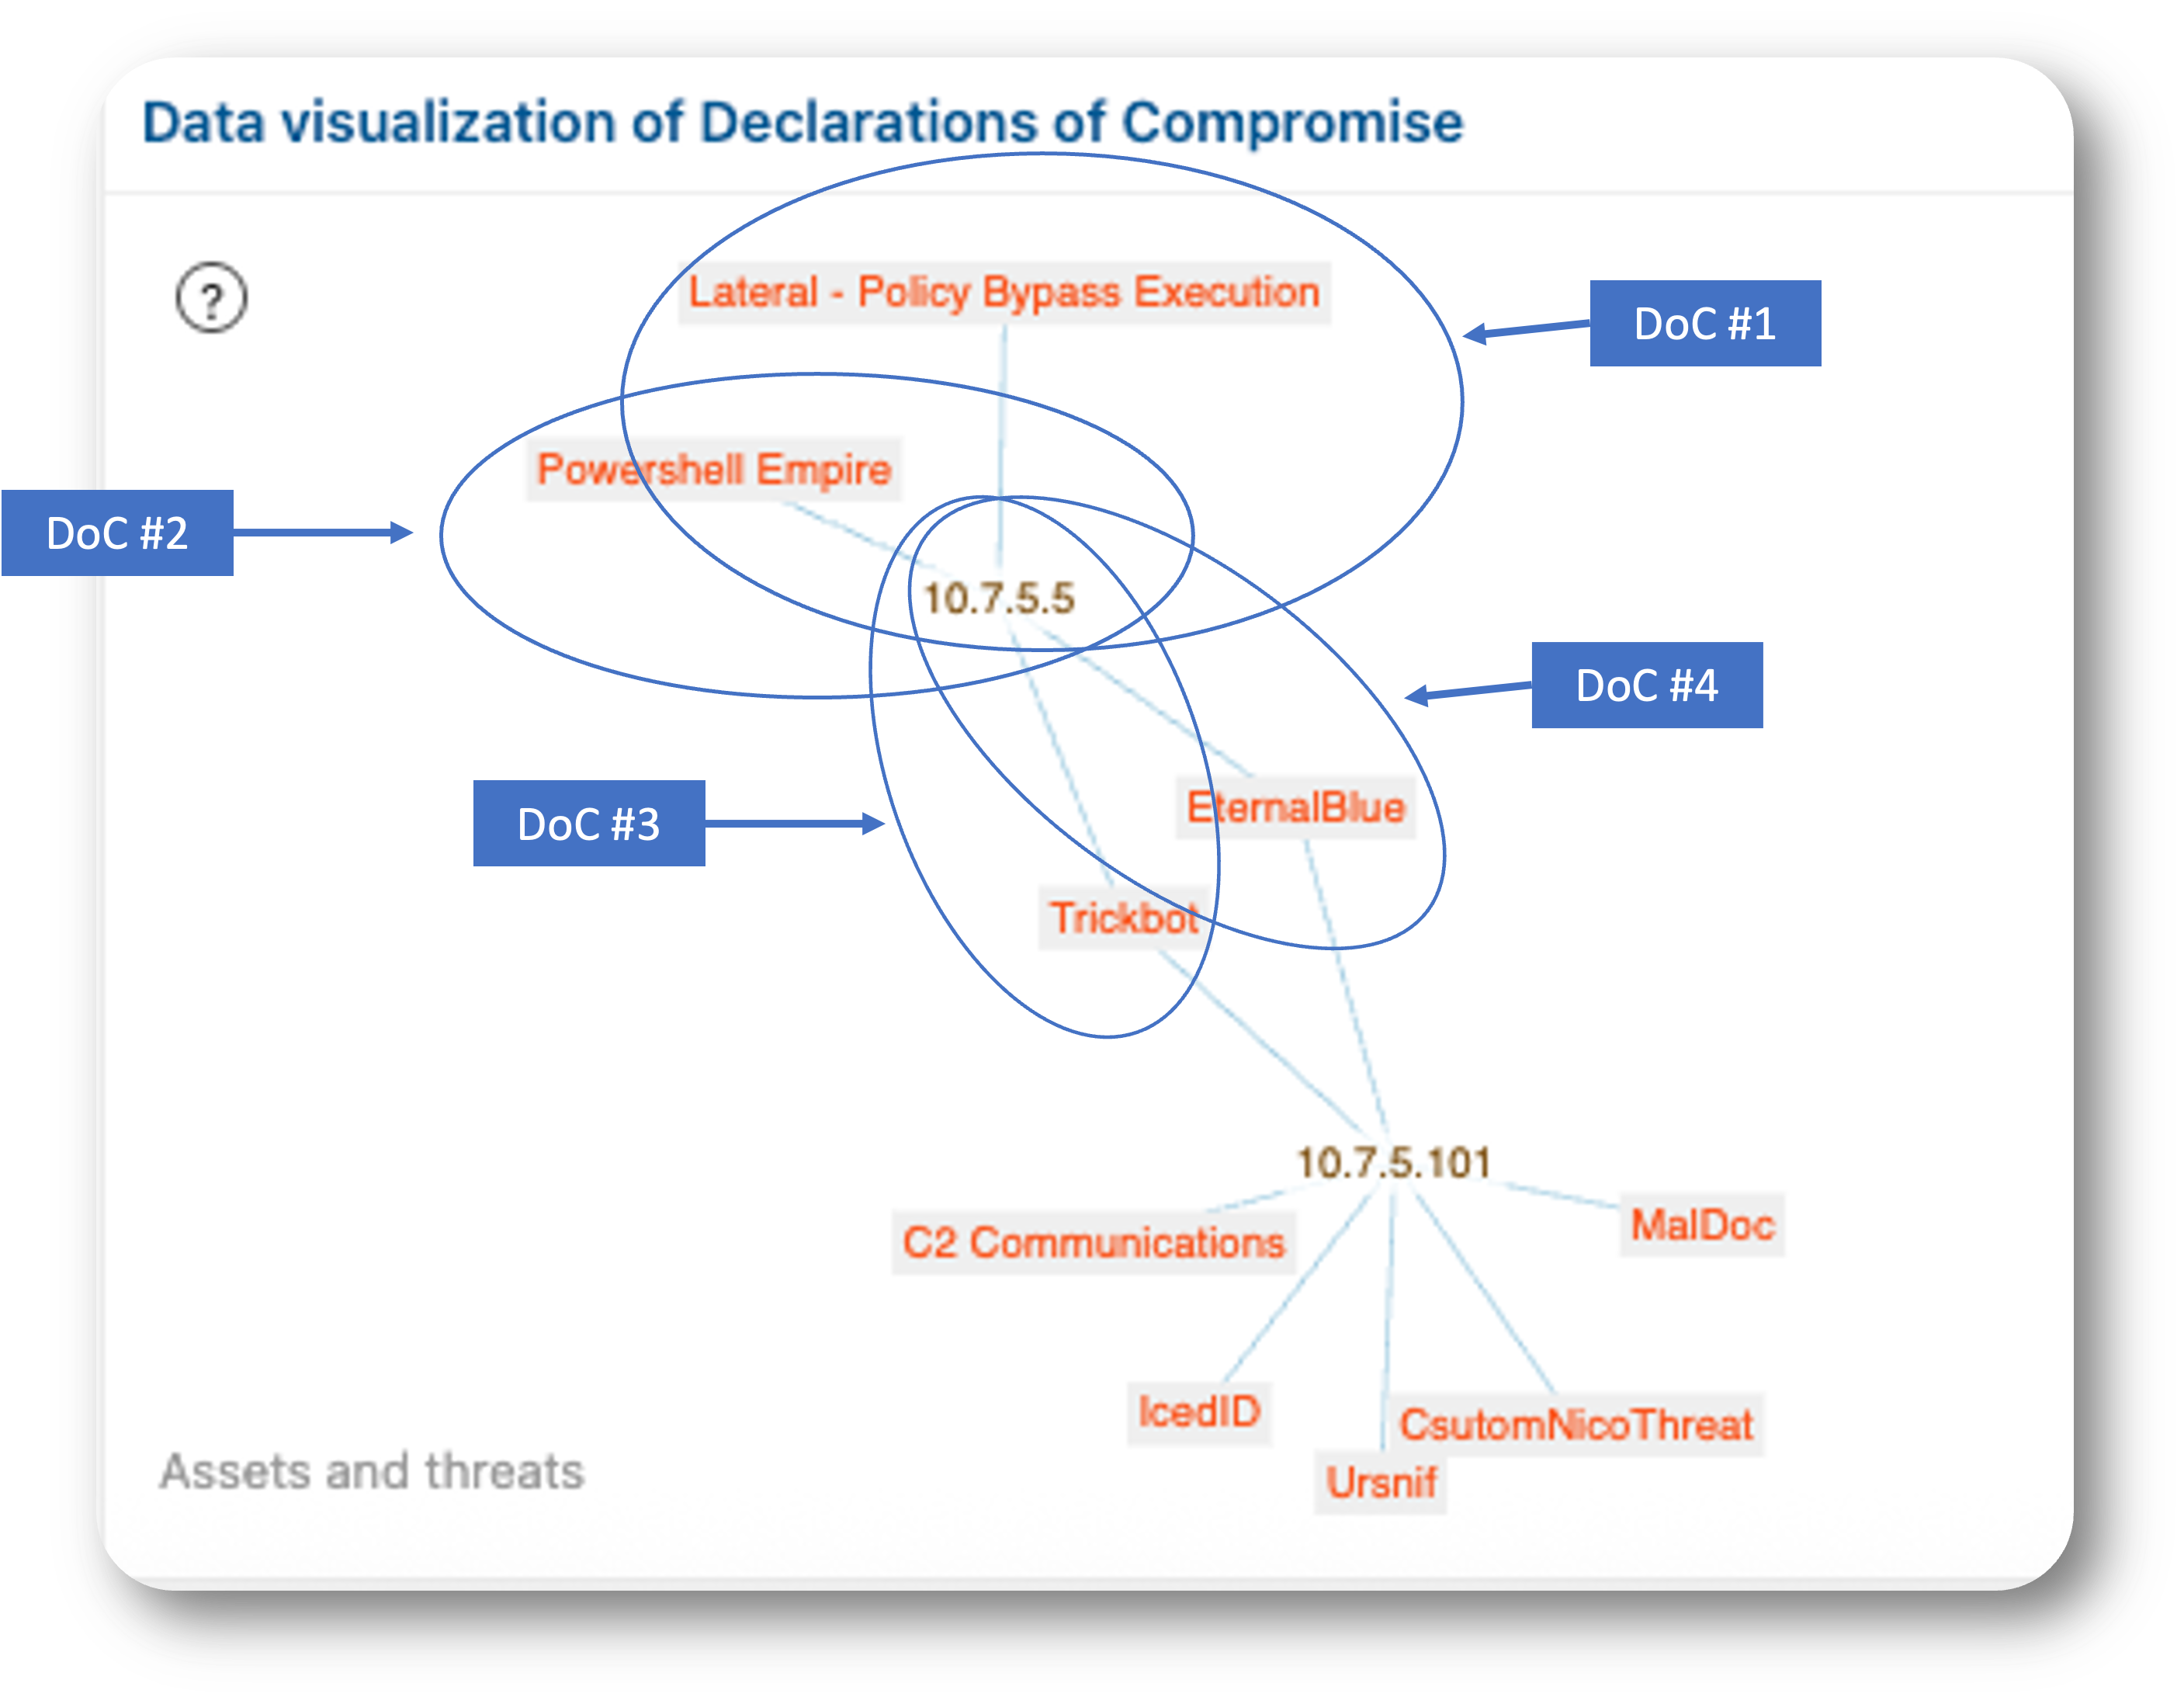
A given asset may be compromised by more than one threat, and as such may be subject to more than one DoC. When an asset is under attack by one or more threats, Clear NDR® logs each of them. The asset will be placed in the highest kill chain phase based on the threats associated. Here’s an example threat visualization from Clear NDR® UI that illustrates this point.
Note
Each one of the event records is accompanied by its associated evidence – including network protocol transaction, anomaly, and flow logs along with the packet capture file (PCAP).
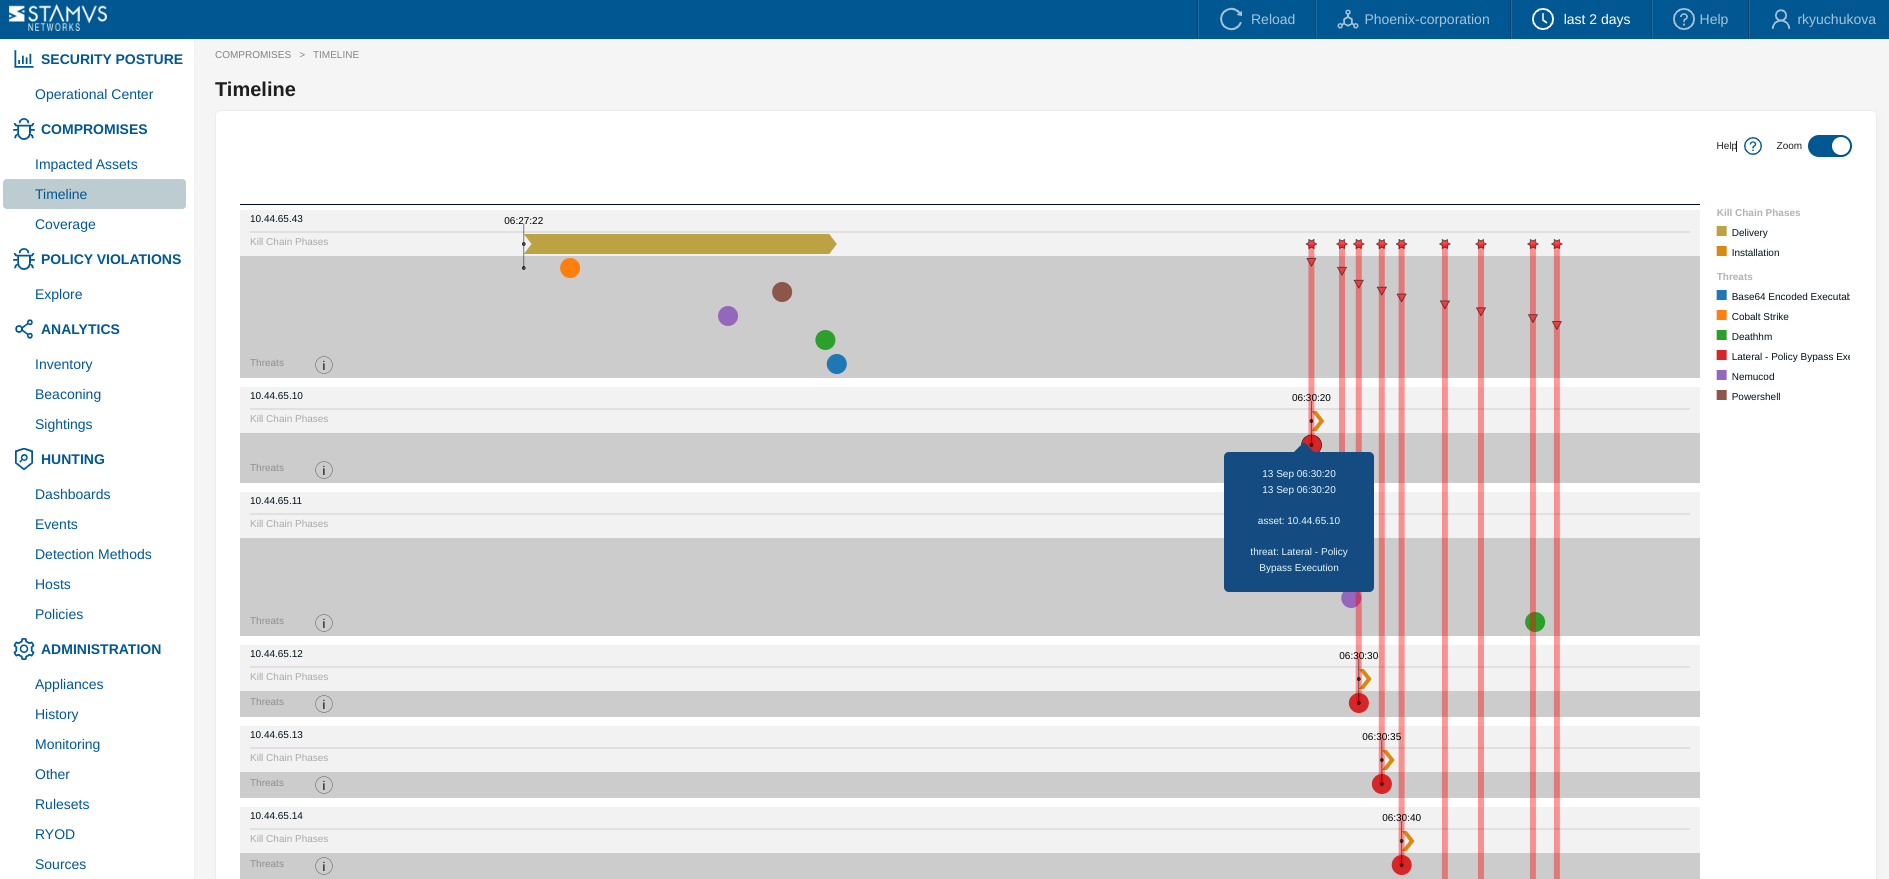
The threat timeline lets you see what happened and when as well as observing lateral movement between hosts if it occurred (as illustrated by the following screenshot, see red arrow moving down from one host to another).
Threat Coverage
Clear NDR® recognizes many different types of threats. The current coverage map of threat families that can trigger a DoC is shown in Clear NDR® screenshot below.
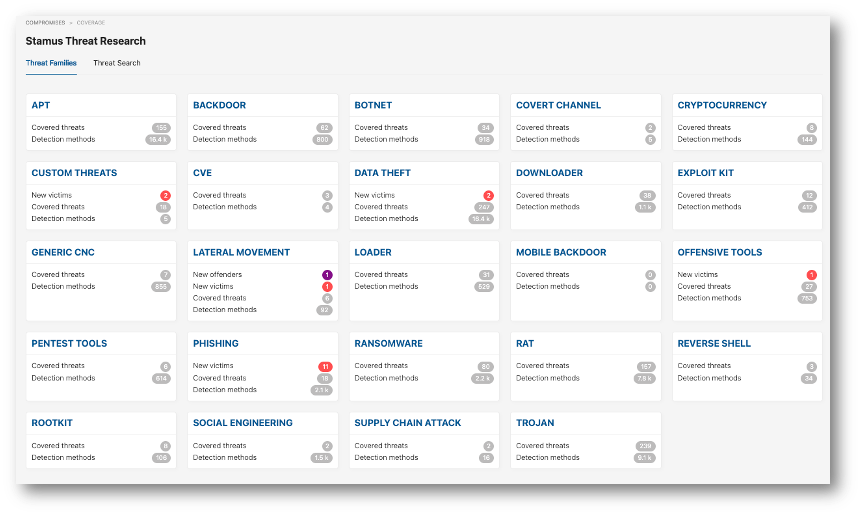
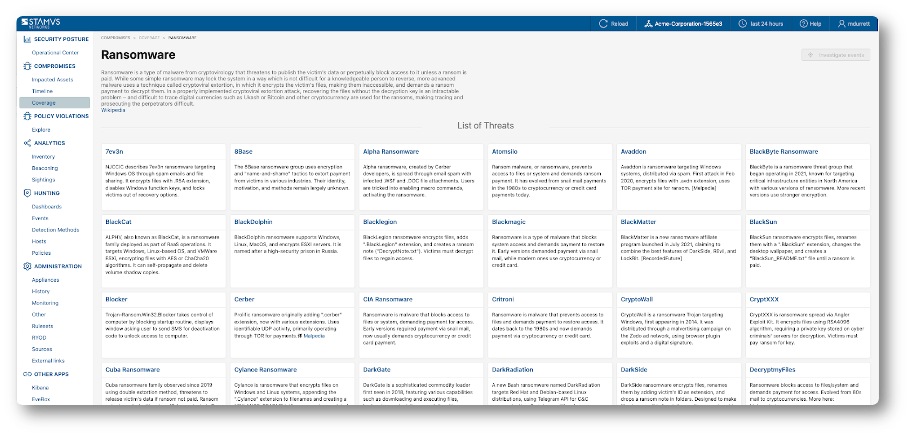
Within a given threat family such as Ransomware, there may be as many as 70 or more individual named threats. Here’s a screenshot from the Ransomware coverage page in Clear NDR® UI.
The DoC event is logged when Clear NDR® detects that an asset is under attack by one of the curated threat detection algorithms or rules that are known to trigger with very high accuracy (nearly zero false positives) and pose an extreme danger to the asset under attack. We call these, detection methods.
Each card shows metrics such as:
New Offenders: Number of newly detected entities acting as offenders.
New Victims: Number of newly detected impacted entities.
Covered Threats: Total threats identified within each family.
Detection Methods: Number of detection methods used for identifying threats.
These metrics help prioritize which threats need immediate attention.
The Coverage page provides actionable insights, facilitates assessing threat detection coverage and identifying areas needing additional focus. In addition to that, Coverage page provides a detailed snapshot of your network’s threat landscape, aiding in effective monitoring and management of security threats.
Stamus Networks includes an updated set of these curated DoC algorithms in the daily Clear NDR® threat detection updates.
Custom DoCs
In addition to those built-in and included in the daily threat detection updates, users may create their own through a process known as escalation whereby the results of an investigation or hunt can be turned into a DoC rule. These custom DoCs may be used for real-time detection in future network traffic or applied retroactively to historic data. More information on how to do that can be found at Custom DoC
Viewing the DoCs in the Hunt and Investigation Console
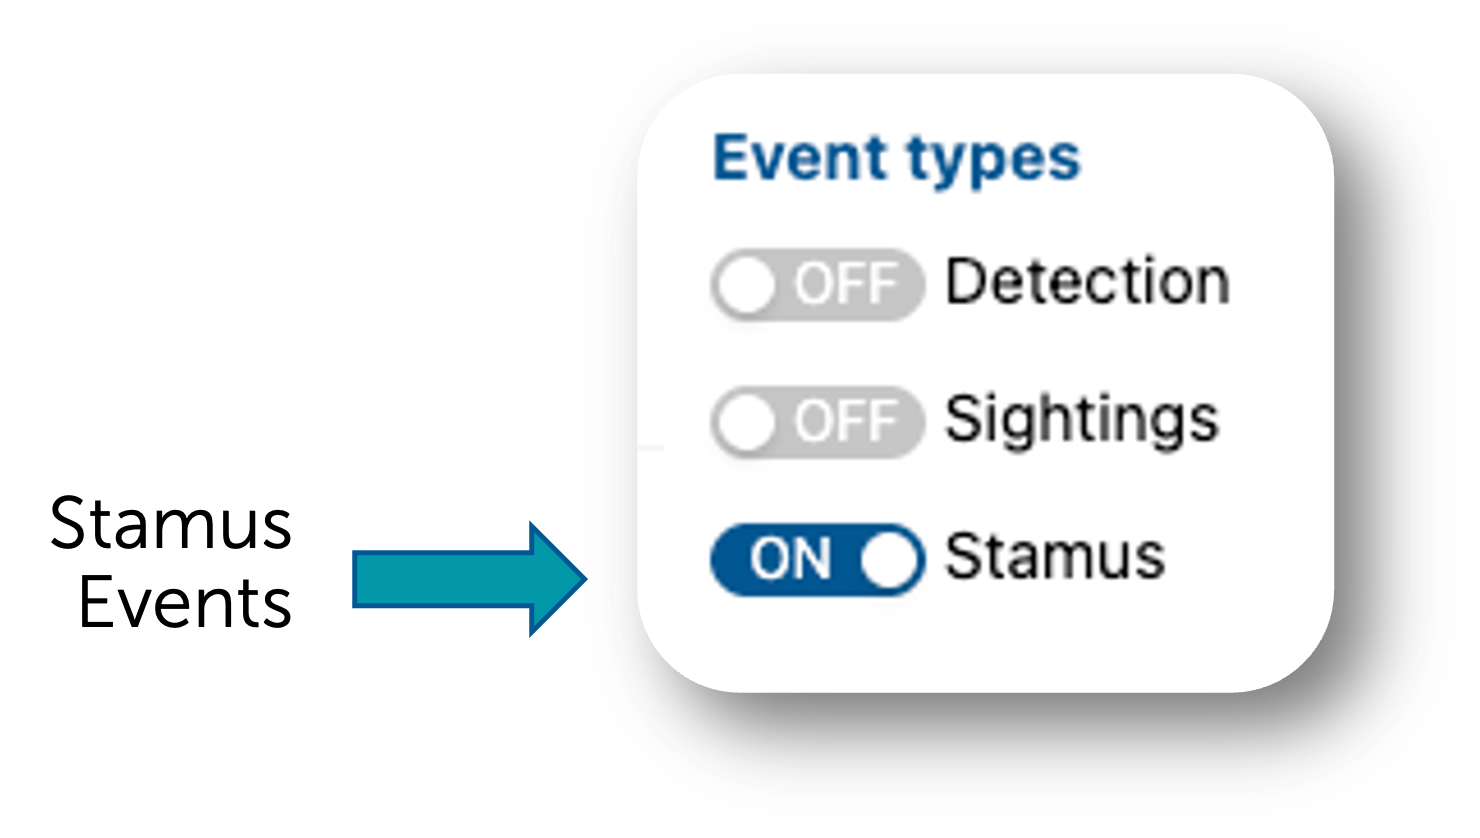
Sometimes it becomes important to view all the DoCs and all the assets under attack from one summary screen. To view all DoCs from Clear NDR® Hunting dashboard, toggle the event times Detection and Sightings to the off position, add a filter to remove the events in the policy violation phase of the kill chain. See instructions below. Further filtering can be performed to investigate one or more of the assets under attack.
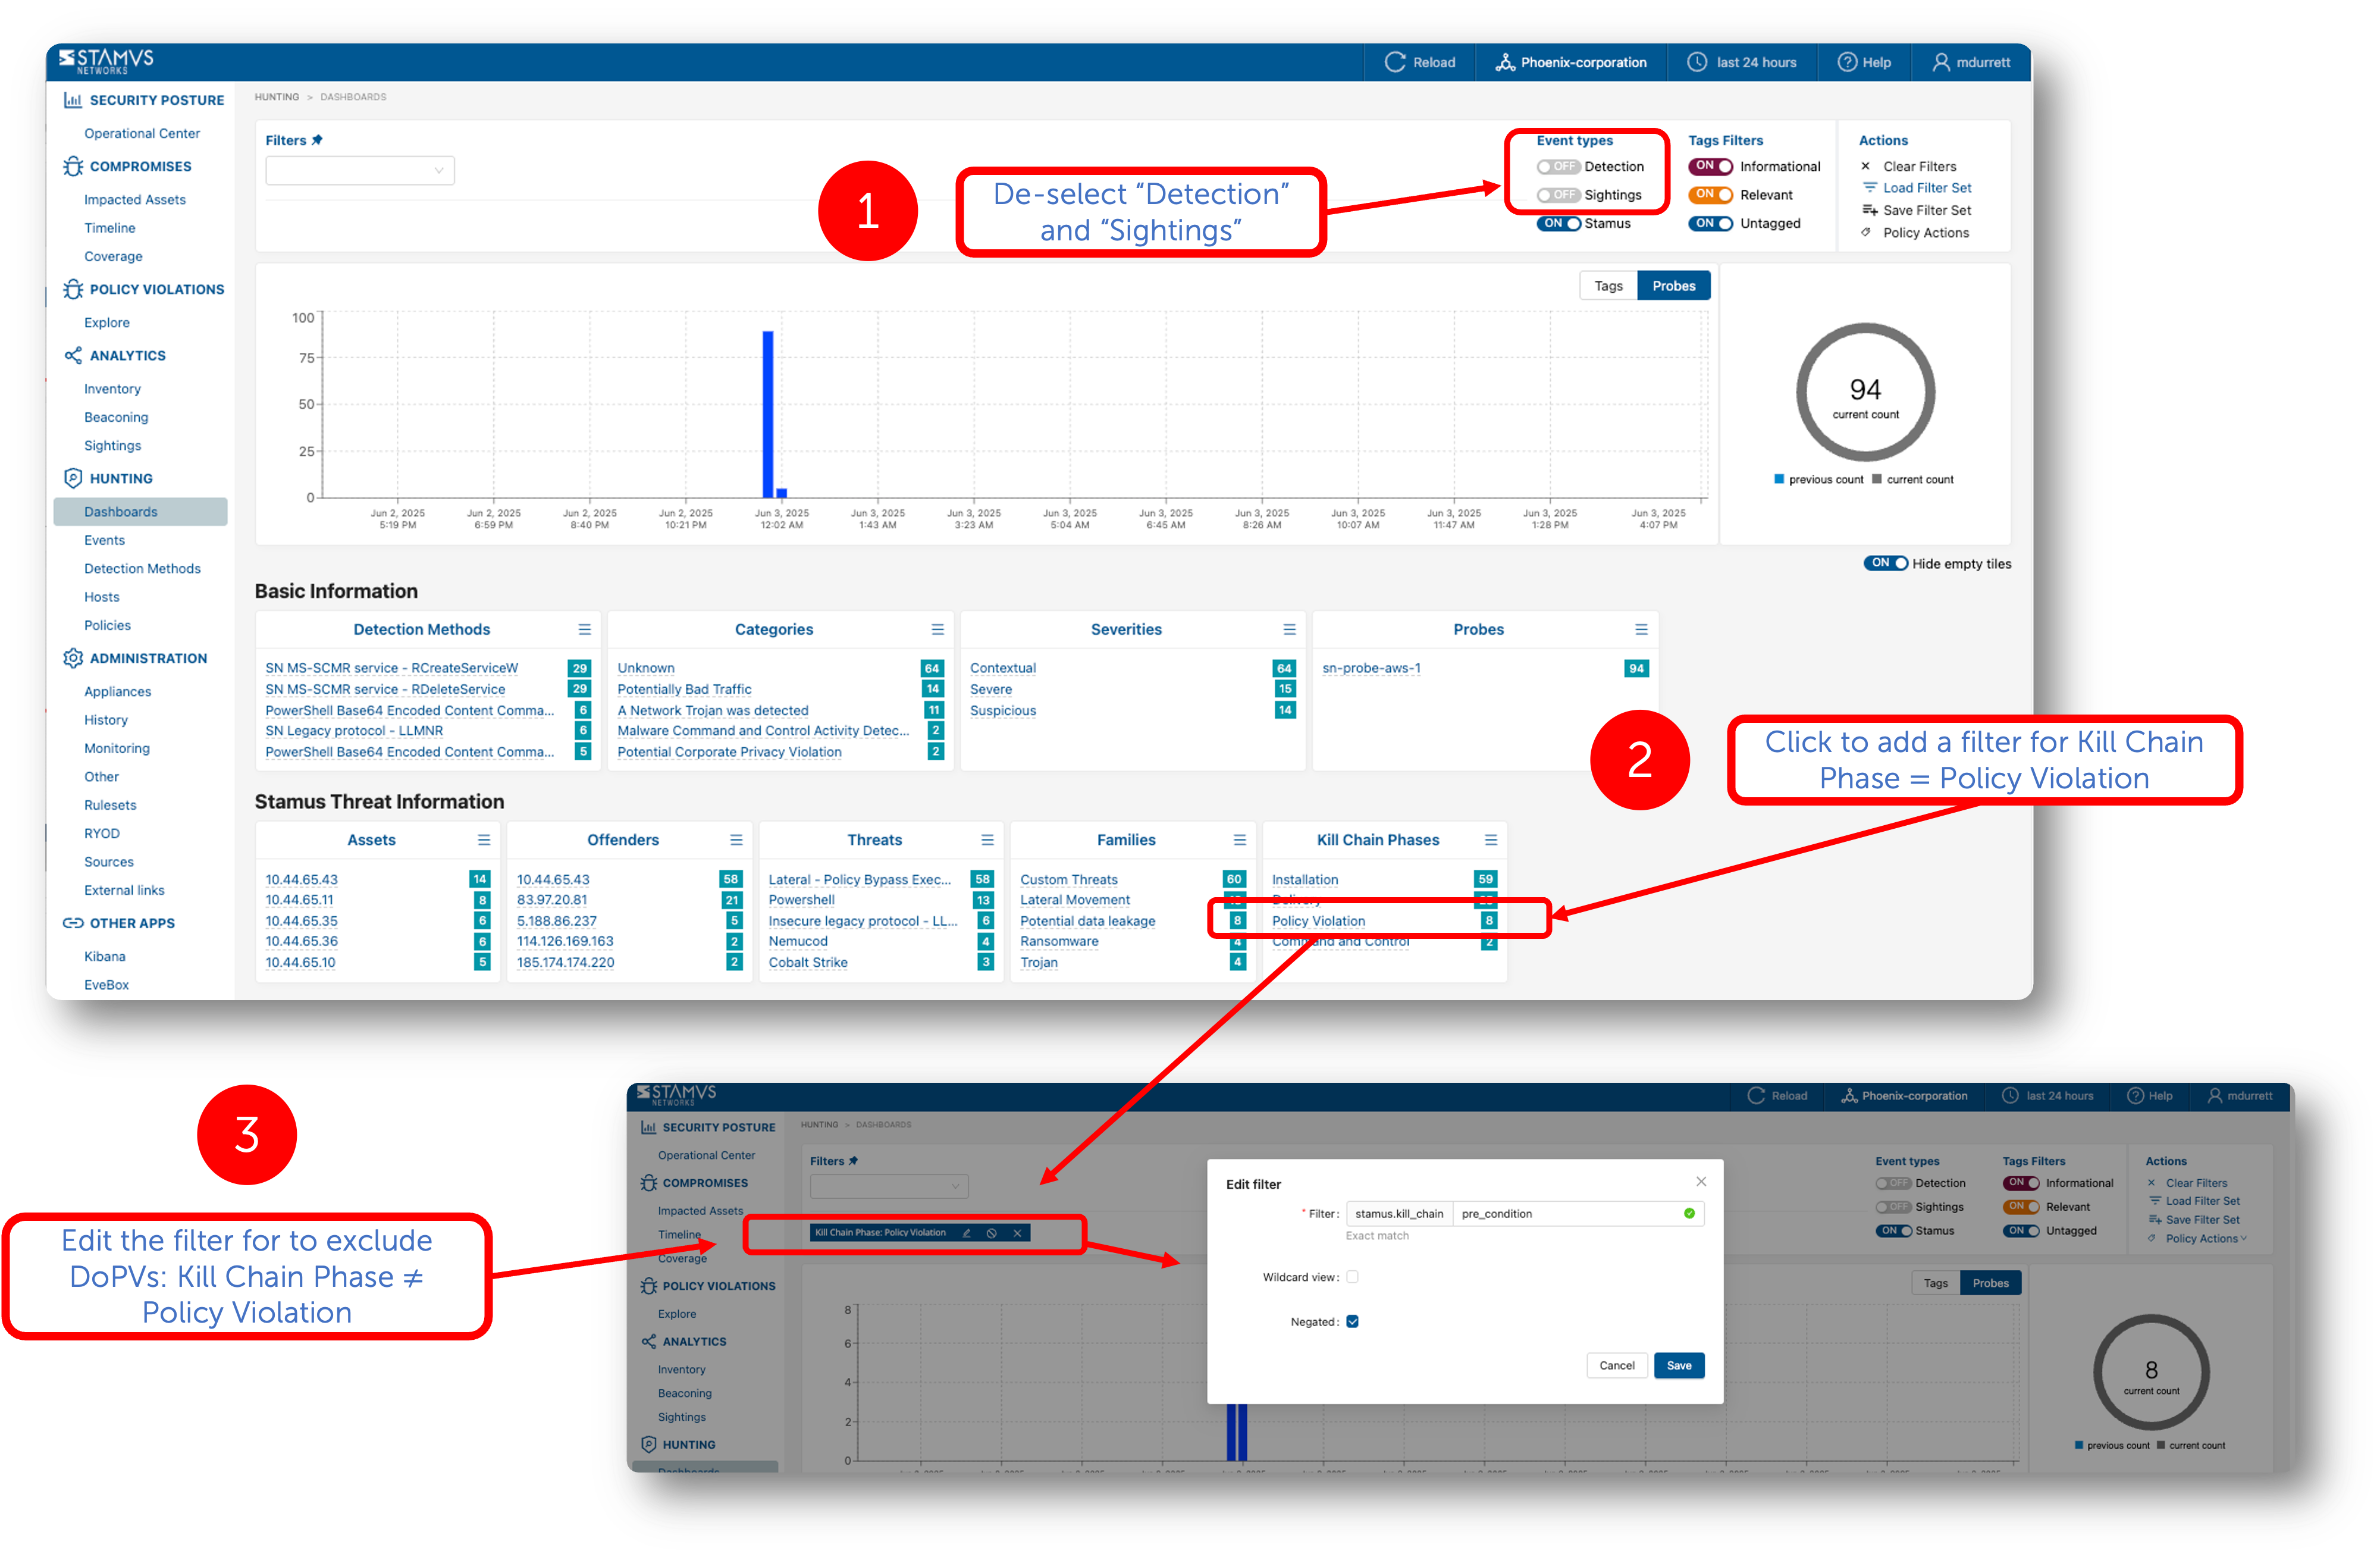
Using the same mechanism, users may also use filters to proactively create a custom DoC for events not yet seen in the network. For example, a user might create a custom DoC by creating a filter to identify an attempt to exploit a particular CVE that is known to be a vulnerability in the environment.
How to Identify DoCs Using a SIEM Query
Below is an example of how to query your SIEM for a DoC. The query uses Event Type = Stamus and the negation to exclude those Stamus events that are not yet associated with a kill chain phase (DoPVs).
Note
This query and results are valid for U42 and later releases.
Query:
"event_type":"stamus" + !(NOT) "kill_chain":"pre_condition" + unique asset_info.incident_id
This will return the DoC JSON log entry that includes Stamus Event information. See example below.
"stamus": {
  "extra_info": null,
  "source": "192.168.2.23",
  "family_name": "Lateral Movement",
  "incidents_id": [71],
  "threat_id": 399,
  "asset_net_info": "wifi-users-hq.organization-acme",
  "pk": 3581,
  "asset_info": {
    "first_seen": "2025-07-24T02:40:34.968258Z",
    "last_seen": "2025-07-24T02:40:44.977144Z",
    "event_id": 88,
    "incident_id": 71,
    "kill_chain": "delivery",
    "state": "ongoing"
     },
  "method_id": 1002026992,
  "family_type": "family",
  "event_id": 88,
  "offender_type": "ip",
  "asset_type": "ip",
  "family_id": 7,
  "threat_name": "Powershell",
  "asset": "192.168.100.60",
  "kill_chain": "delivery"
}
See Stamus Events for more information about the Stamus Event JSON log entry.
Note
This query returns only the first Stamus Event that triggered a DoC on an Asset.
Important
For detailed explanation of each field please refer to Stamus Events
DoC Interface Overview
Threat Coverge Page
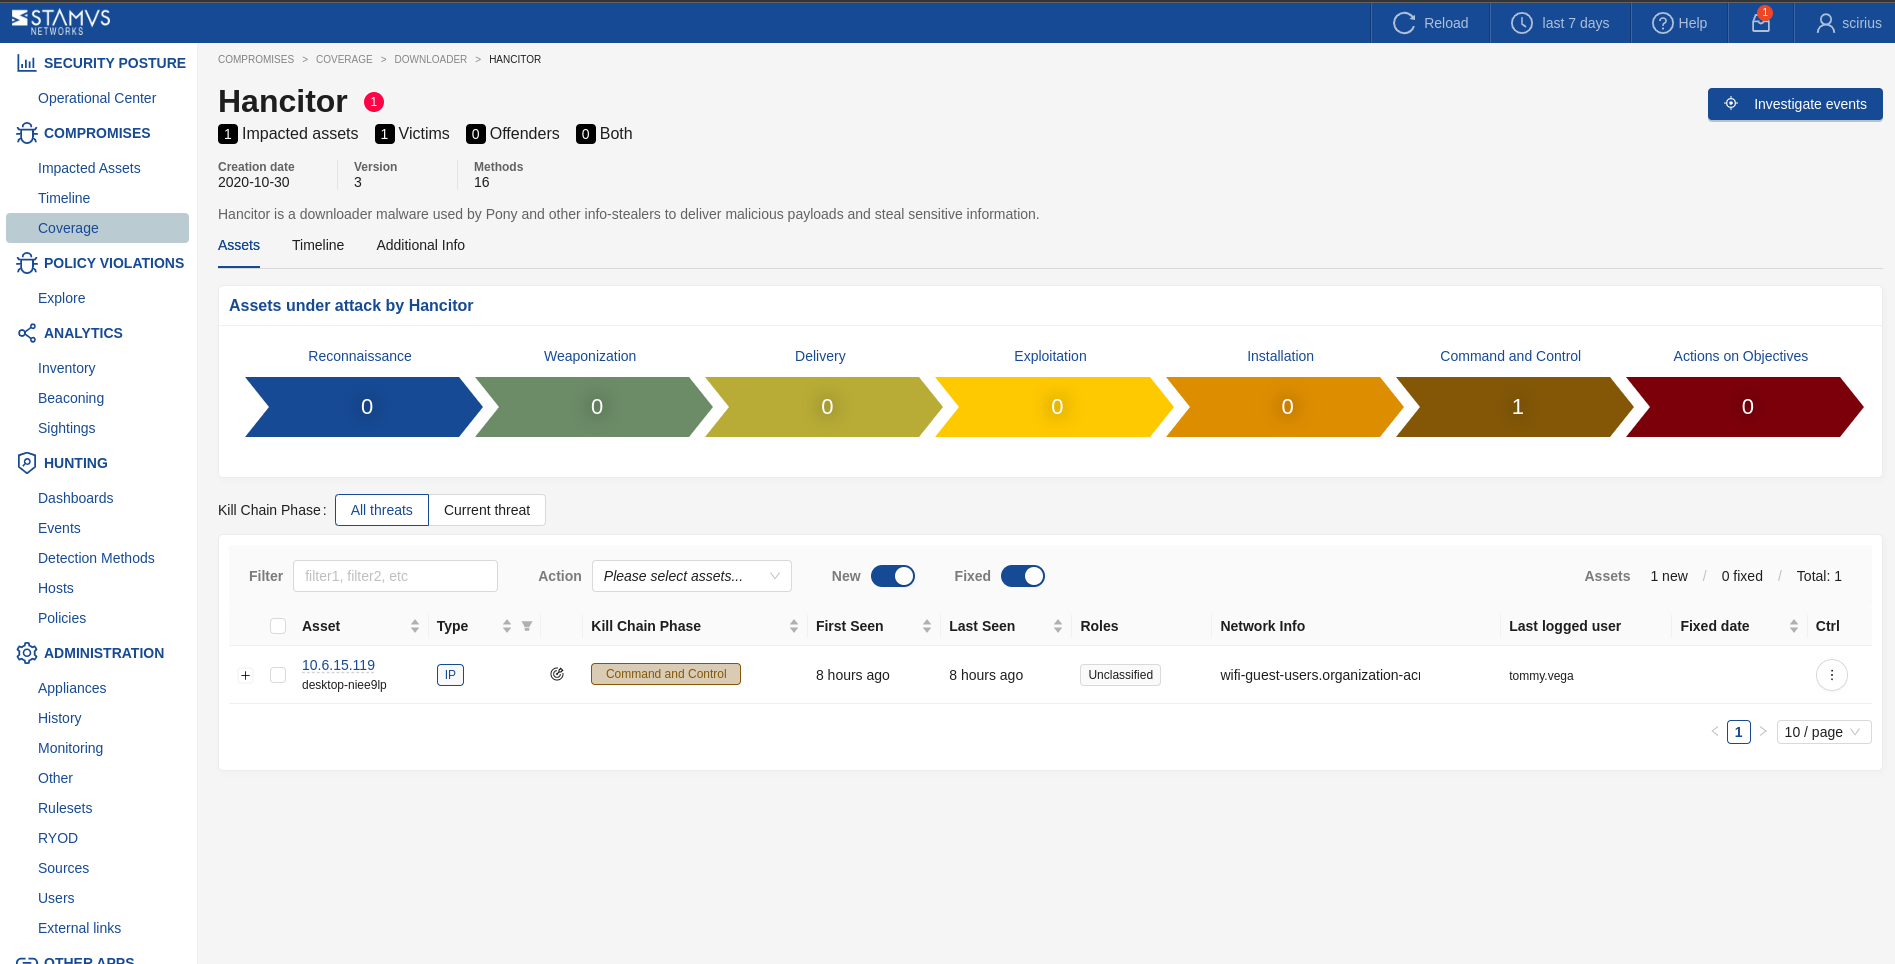
The Threat Page provides a detailed view of a specific threat detected within your network. It helps gain understanding about the threat’s behavior, associated assets, and its progression through the cyber killchain.
Key Components
Threat Overview:
Displays essential information about the threat, including its name, creation date, version, and the number of detection methods associated with it.
Provides a description of the threat, outlining its behavior, typical attack vectors, and related malware or techniques. Links to external resources such as MITRE are included for additional threat intelligence.
Assets Under Attack:
Shows a list of assets currently impacted by the threat, including details such as asset names, IP addresses, and hostnames.
Displays the kill chain phase each asset is currently in, helping users quickly identify where in the attack lifecycle each asset is affected.
Provides filters for refining the asset list by type, status (New, Fixed), and other attributes, enabling targeted analysis.
Kill Chain Visualization:
Illustrates the threat’s activity across different phases of the kill chain, such as Reconnaissance, Delivery, Exploitation, and Actions on Objectives.
Highlights the specific phases where the threat is currently active, aiding in understanding the progression and potential impact of the threat.
Tabs for Additional Information:
Assets: Lists all affected assets and their details.
Timeline: The Timeline tab visually displays the sequence of threat events over time, highlighting when and how assets were impacted. It represents different killchain phases and provides detailed event information on hover.
Additional Info: Offers extended information on the threat, including external links.
Investigate Events Button:
Similarly to the Investigate Events button on the Threat Family pages, this functionality allows you to delve deeper into specific events related to the threat (by automatically applying a
Threatbased filter), providing access to detailed evidence and enabling further investigation.
This page serves as a central point for analyzing a specific threat, offering all necessary data to understand its impact on the network and to take appropriate mitigation actions.
Assets Expanded View
Threat Information Tab
The Threat Information tab provides a comprehensive overview of the selected threat, detailing its behavior, associated tactics, and impact on the network. This tab is designed to help security teams understand the nature of the threat and plan appropriate response actions.
Threat Description:
Offers a detailed explanation of the threat, including its origins, typical behavior, and how it spreads. It often includes links to external sources for additional context and intelligence, such as MITRE or other threat databases.
Victim of:
Lists the malware, exploits, or tools that are targeting or have been used against your assets. It provides context on how your assets are being exploited by the threat, along with associated tactics used by the attackers, such as phishing, malware delivery, or command and control activities.
Offender Using:
Displays information about the offensive tools and techniques employed by the threat actors. This section includes details on how the attackers are leveraging specific tools, malware, or exploits to achieve their objectives.
Timeline:
A chronological display of events related to the threat, showing when the threat was detected and how it has interacted with your network over time. This timeline helps in visualizing the threat’s progression and assists in correlating threat activities with observed network behavior.
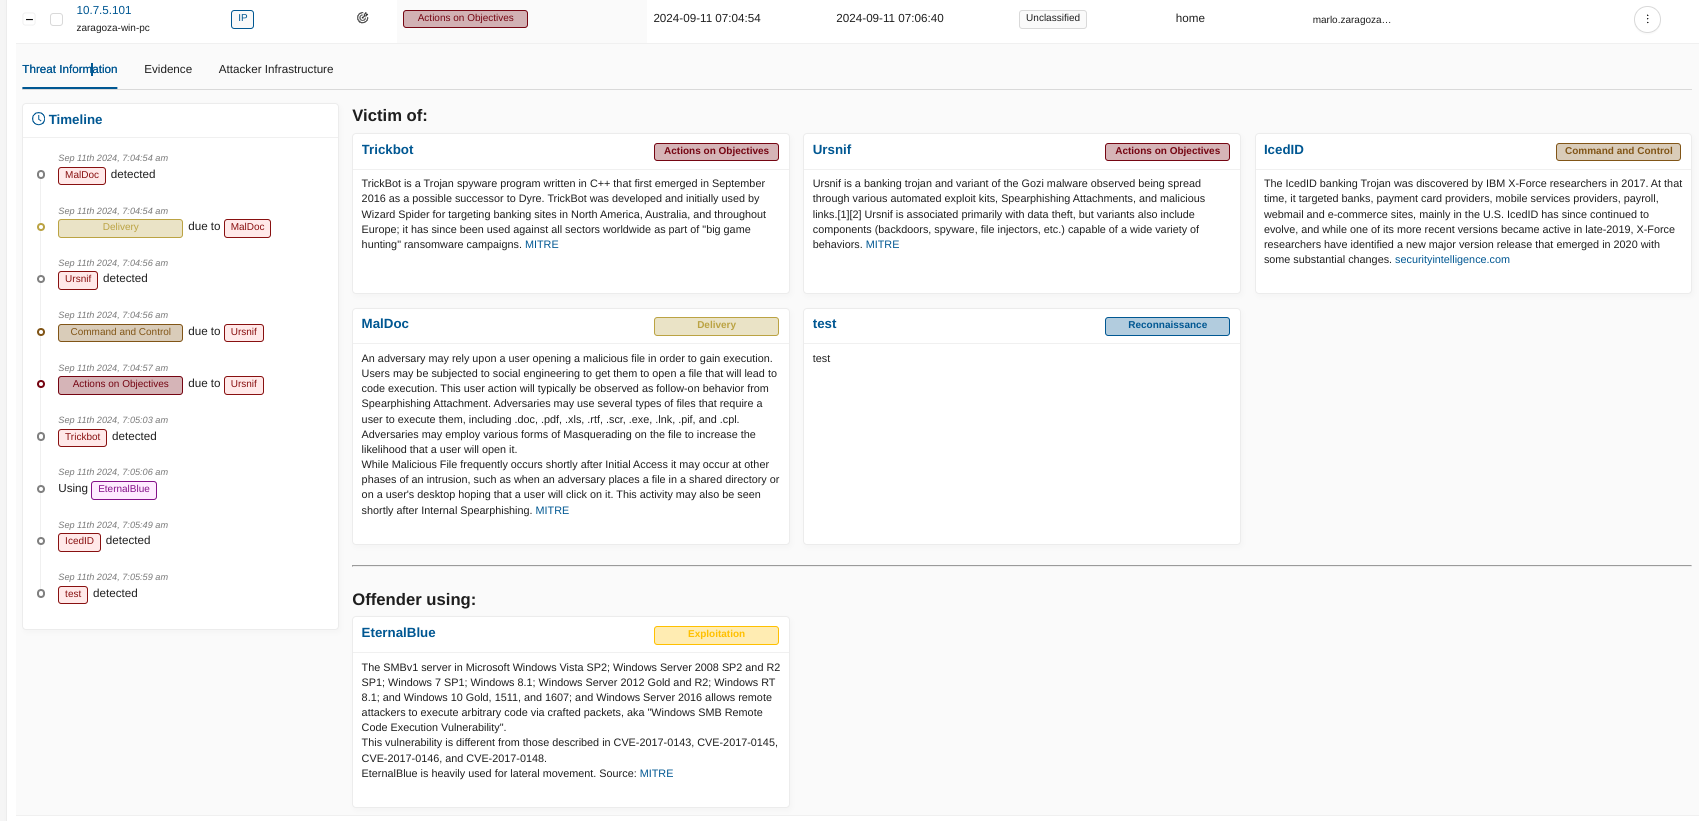
The Threat Information tab serves as a critical resource for understanding the specifics of a threat, including how it operates, what vulnerabilities it exploits, and the stages of the kill chain it affects. By providing detailed threat intelligence, this tab aids in the development of targeted mitigation and response strategies.
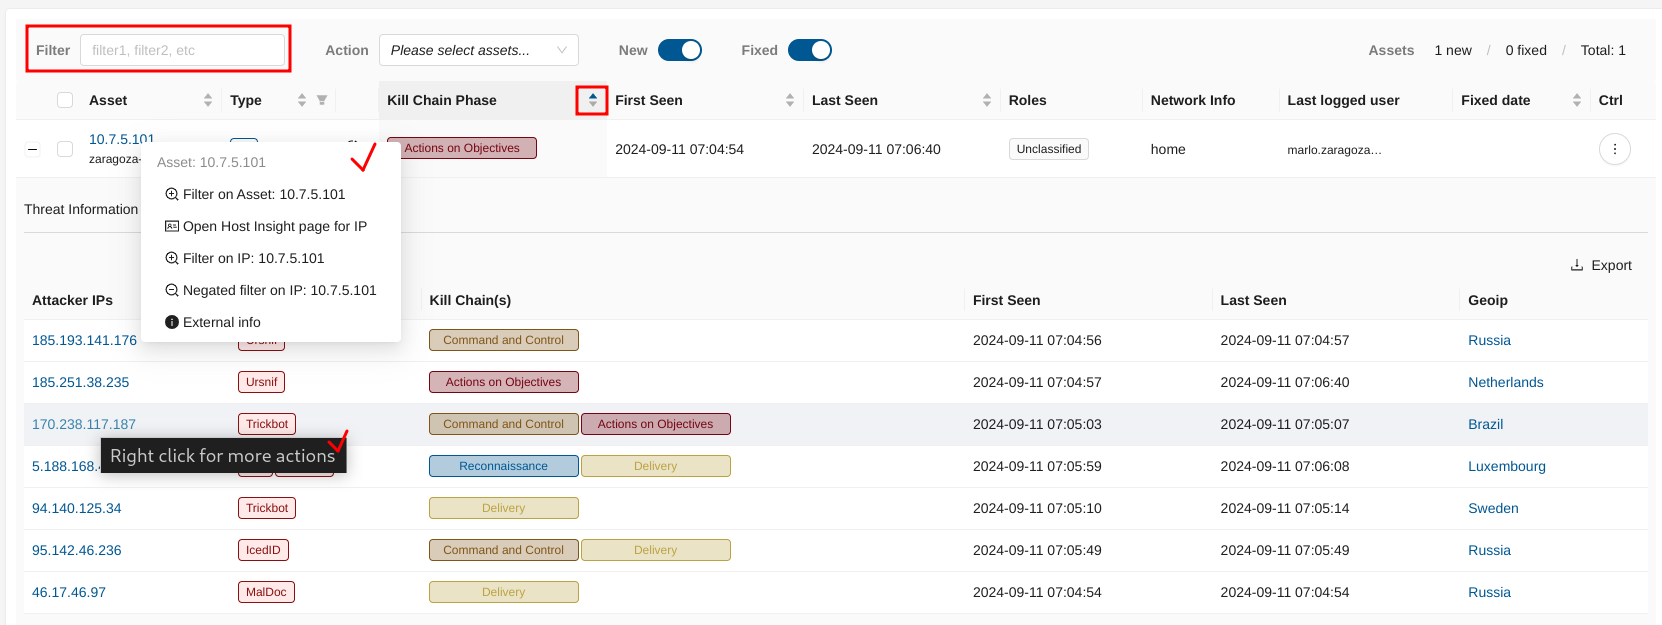
Evidence Tab
Provides a detailed view of the evidence collected related to the detected threat. This tab helps security teams analyze and understand the context of the threat, including the associated attacker infrastructure, threat activities, and their impact on your network.
Attacker IPs:
Lists the IP addresses identified as part of the attacker infrastructure. These IPs are associated with various malicious activities or threat actors targeting your network.
Threat(s):
Displays the specific threats linked to each attacker IP, such as malware, exploits, or other malicious tools used by the threat actors. Each threat is labeled for easy identification.
Kill Chain(s):
Shows the phases of the kill chain where the identified threats are active, such as Command and Control, Delivery, or Actions on Objectives. This visualization helps in understanding the progression of the attack.
First Seen / Last Seen:
Indicates the timestamps of when the threat activity was first and last observed, providing a timeline of the threat’s presence in the network.
GeoIP Information:
Provides geographical information about the attacker IPs, showing the origin of the attacks based on IP geolocation data.
Export Option:
Allows users to export the evidence data (in csv format) for further analysis, reporting, or sharing.
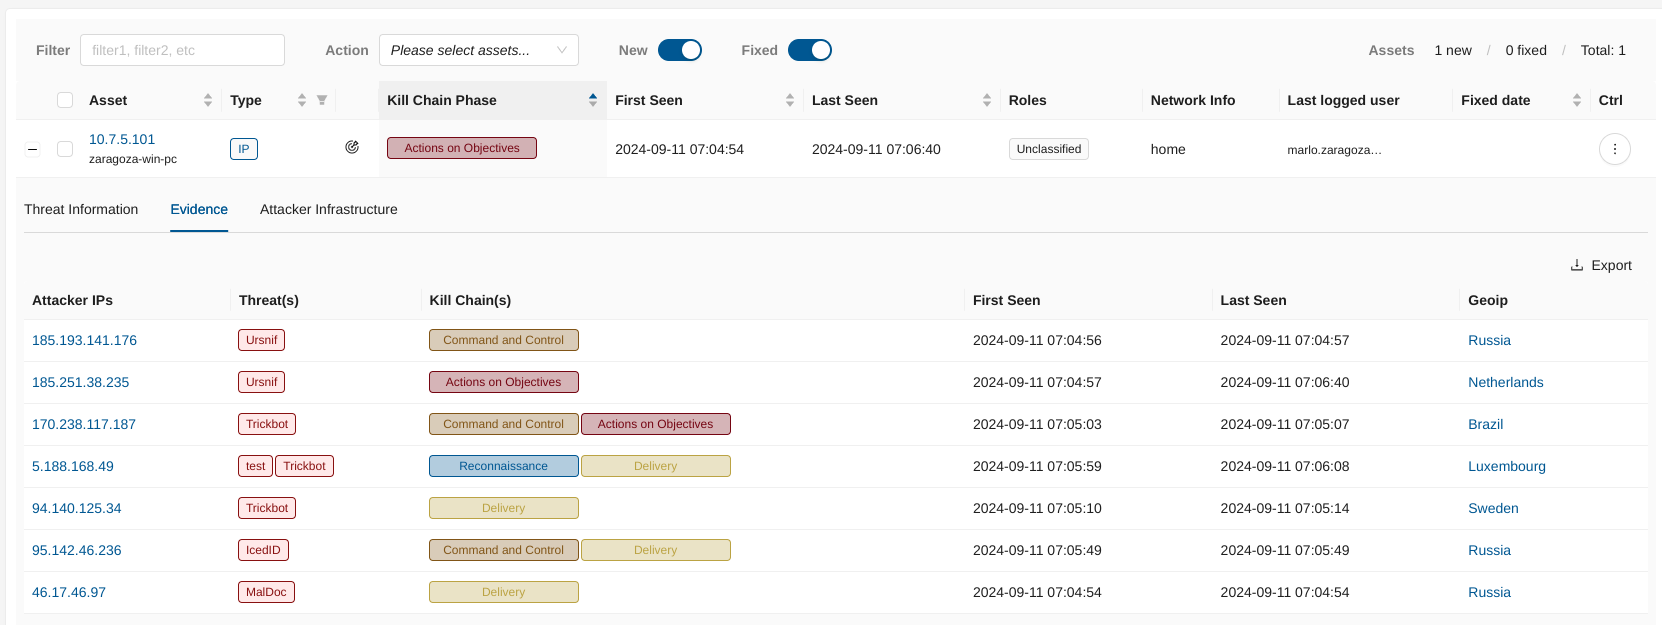
The Evidence tab consolidates critical information about threats and attacker activities, enabling a comprehensive analysis and aiding in decision-making for threat response actions.
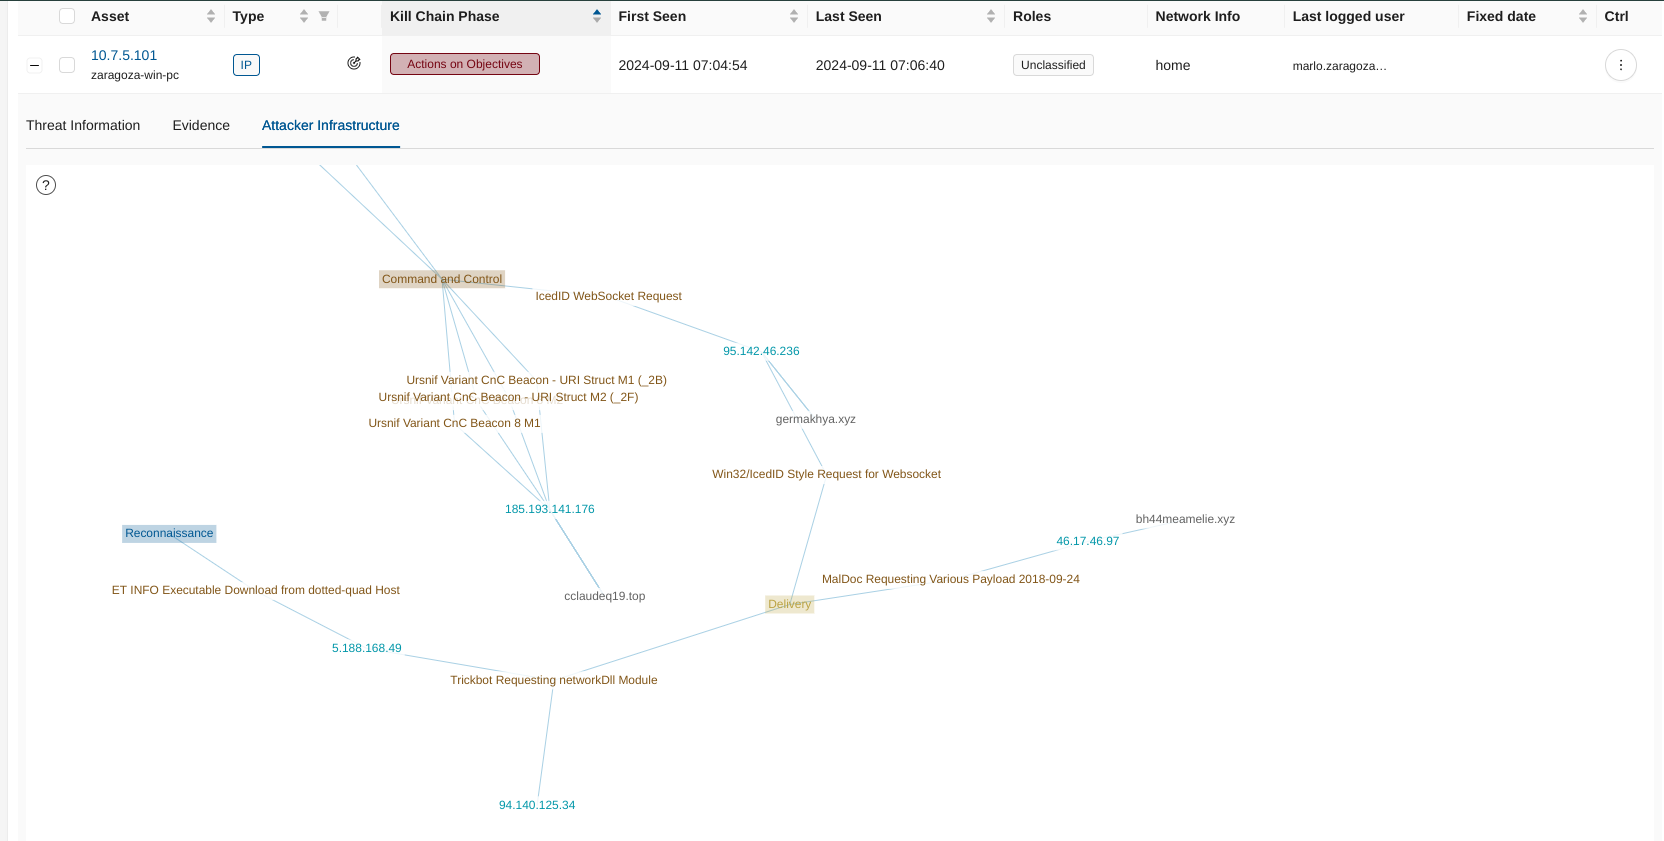
Attacker Infrastructure Tab
Very useful in visualizing the connections between attacker IPs, domains, and threat activities, mapping out the attacker’s network and highlighting associated kill chain phases.
Filtering, Sorting, Navigation
Filtering and Sorting: Use filter input field to refine the view of assets. Use sorting on tables by criteria such as kill chain phase, asset type, asset IP, first seen or last seen.
Navigation and Redirection: Use the left/right filter menus to easily navigate to related pages, such as hosts or policies, for broader context and to take further action.
The Threat page serves as a central hub for threat analysis, providing all necessary information to understand and mitigate threats effectively within the network.
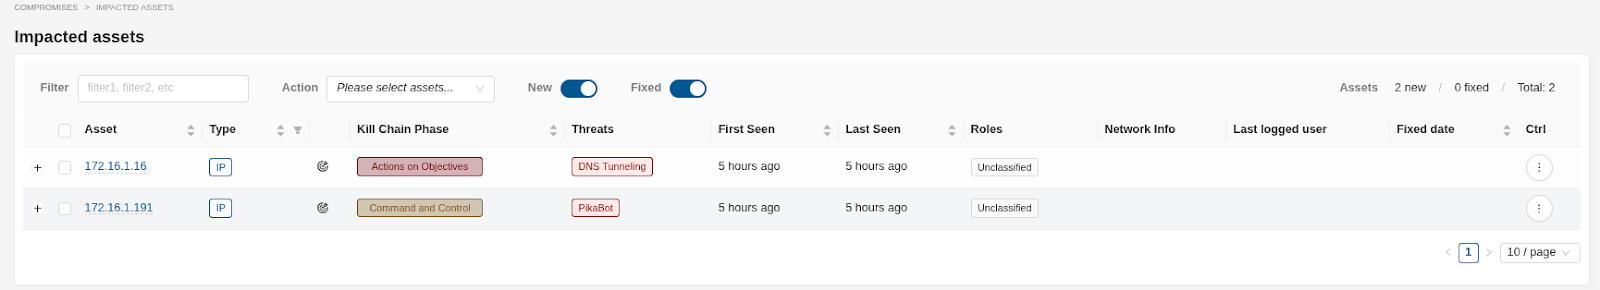
Impacted Assets
This page allows viewing which asset is under attack and by which threat. An asset can be impacted by one or more threats.
The table allows:
Filtering on different Assets (by using the Filter input field)
Redirection Right click on Assets and get redirected to other actions and views like HostIsnights, filtering, external linking etc.
Performing Actions on Assets from the
Actiondropdown menu, likeAcknowledgeand/orRevertSwitching between
NewandFixedAssets list viewCounters for
new/fixed/totalAssets (Note that when using theNewandFixedswitches, Total count is aggregated, based upon the selected switch).Sorting in asc or desc order, and also - by
Asset Type(either Username, Email or IP)- Information on:
Asset HostID information- by clicking on the Asset linkThreatsfrom which the Asset is part ofFirst SeenandLast SeenNetwork info- if availableLast logged user- if availableFixed date- it is displayed only for a Fixed / Acknowledged Assets
Ctrl button - allows you to Acknowledge or Revert an Asset
Investigation Routines for DoC
This section outlines a methodology for a structured approach on how to respond to a DoC and how to investigate and subsequently hunt for threats using Clear NDR.
Note
For correct operation, including detection of lateral movement, a Variables of the setup is essential.
Also for complete setup, proper external escalation on What are Webhooks? configuration is also necessary.
Analyze
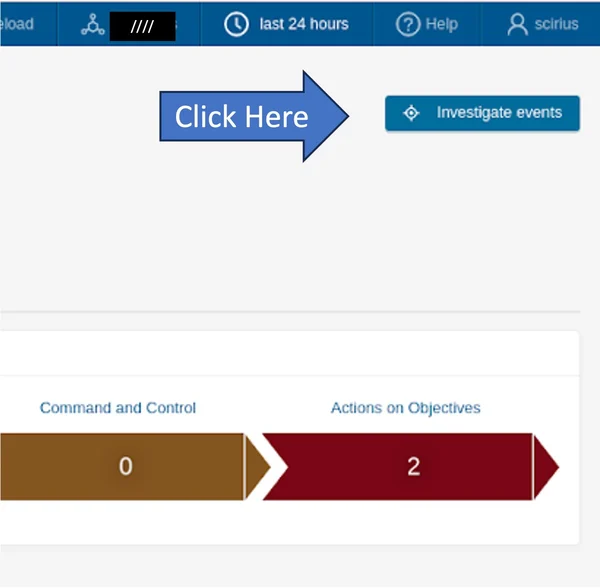
Objective: Review and analyze active DoCs that Clear NDR has automatically detected.
Methods:
Go to the Operations center: Review the high level activity.
Access the DoC Interface: Navigate to the Impacted Asset section in the Clear NDR interface:
Review the impacted assets page: Examine the list of generated DoCs, paying attention to the following key fields:
Kill Chain Phase: Prioritize investigations based on the phase and the criticality of the asset - prod / infra servers for example. The further to the right of the Cyber Security Killchain , the higher the priority. For example, prioritize investigating DoC in the Actions on Objectives Phase.
Role: Take into account the role of the particular asset when starting the investigation. For example, if a data center is under attack, this is the priority and a particular attention should be paid to this asset when doing the threat hunting.
First Seen / Last Seen: Determine the timeline of the activity. Recent and ongoing DoCs should take precedence.
Evidence: Review the supporting evidence provided by Clear NDR, such as offenders IP addresses (IPs), threats, kill chain phase, timeframe (first seen, last seen) and GeoIP data.
Status: Track the investigation status of each DoC (Acknowledged/Not Acknowledged).
Review Evidence
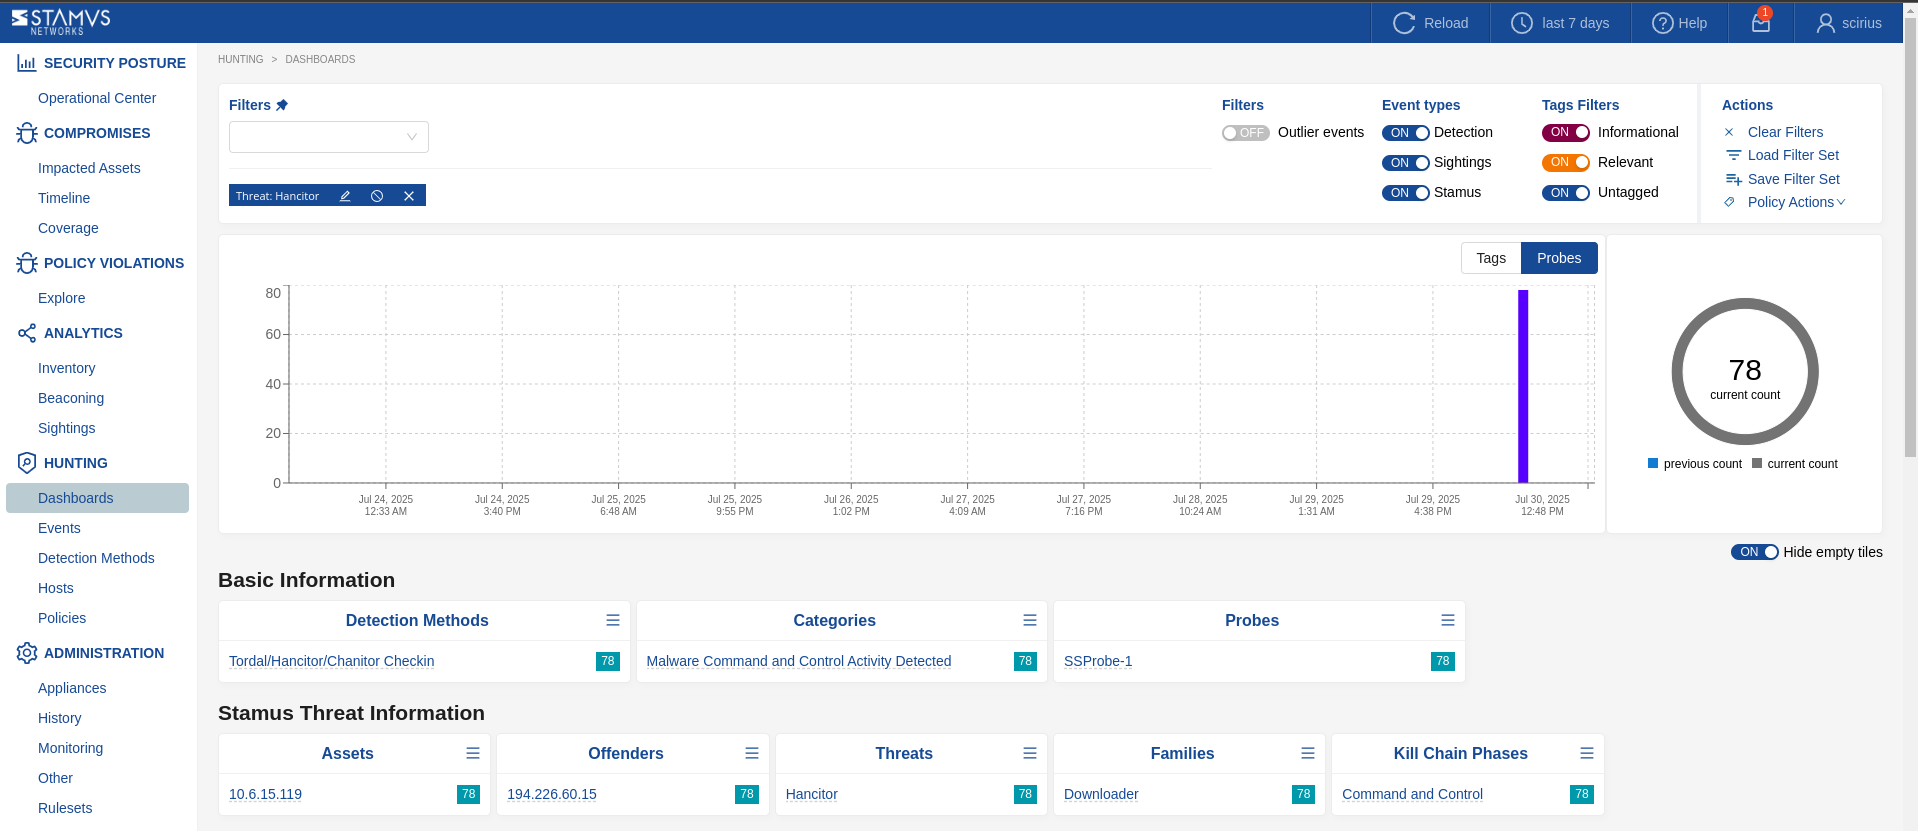
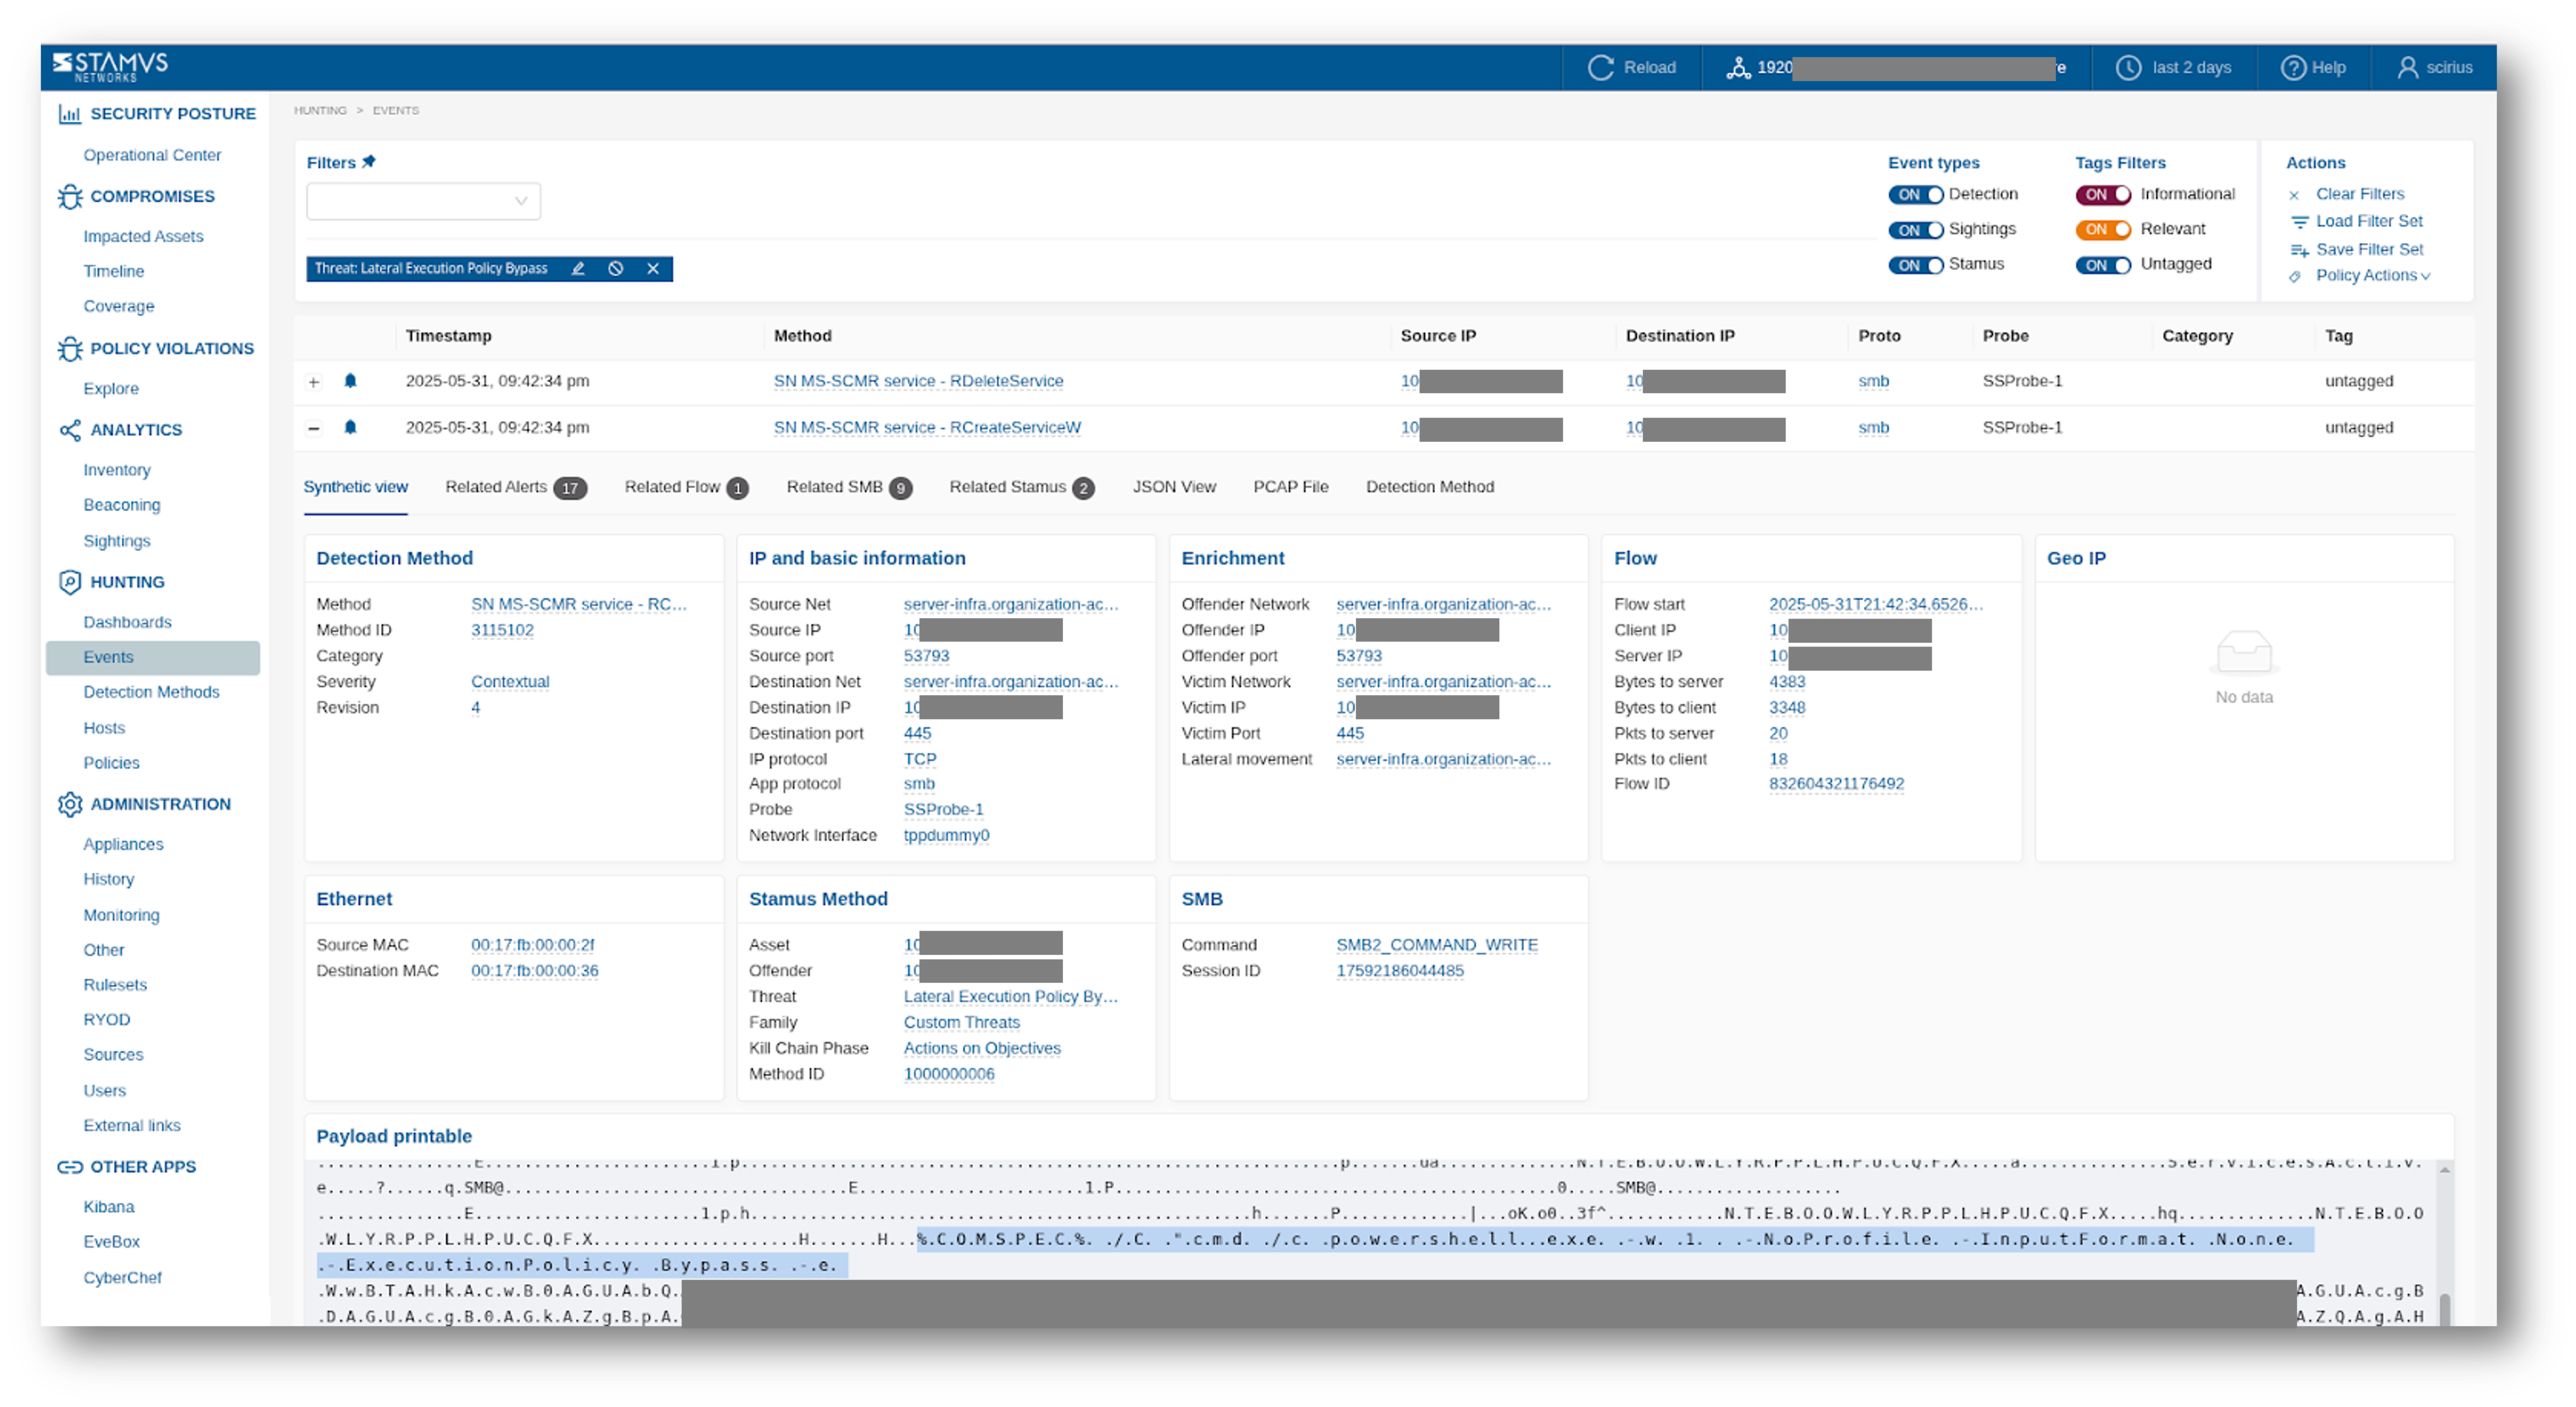
For a selected DoC, use Clear NDR’s pivoting capabilities in this blog post, we go in depth on how to quickly pivot from an event to the actual evidence to explore related network events:
Review the network forensics evidence, time, directionality, and infrastructure involved. Evaluate if this is expected to occur to and from these endpoints. As shown on the screenshot below, all accompanying network protocol, flow logs, packet capture files (PCAPs), and detection method logic is presented with a simple review of the screen - to confirm the incident:
Review the Offender Infrastructure
If available, the offender infrastructure involved in the incident will be displayed – see the screenshot below for an example:
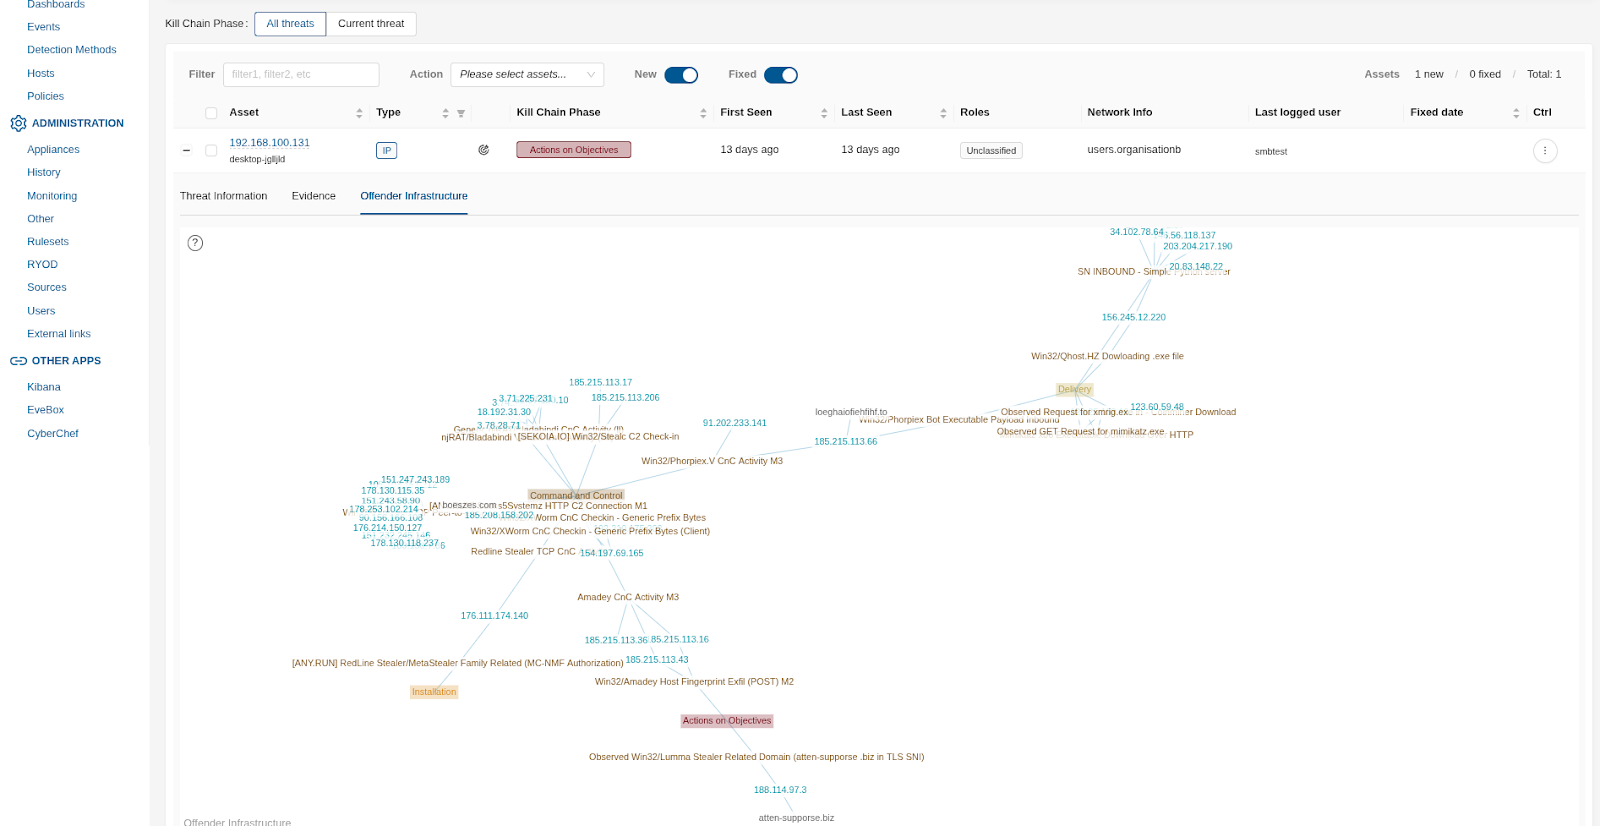
From the screen shown above, any related detection method or kill chain phase can be reviewed separately if needed, with all its accompanying network forensics logs and evidence (PCAP). To do that, simply click on the detection method or killchain phase.
Prioritize Investigation
If there is more than one host affected, prioritize your investigation based on the criticality of the asset or network device type. For example, investigating threats on assets such as gateways, firewalls, routers, backup servers, management servers or production servers should be a top priority.
Pivot, Explore and Investigate
Review Host Insights
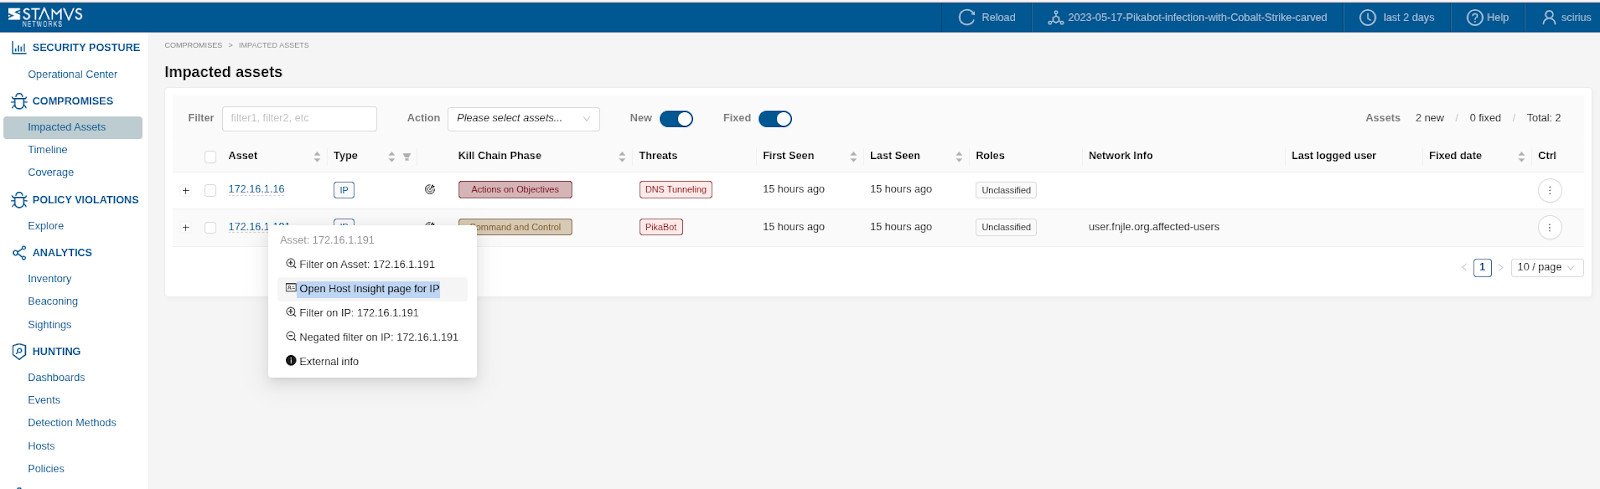
View Host Details: Investigate the activity of the involved internal host(s) by examining their communication patterns, historical events, and associated metadata. As shown on the screenshot example below, pivoting to Host Insights (please see Introduction) can be performed with a right click from Impacted Assets page.
View Flow Data: Analyze the network flows associated with the DoC to understand the full context of the communication (e.g., protocol details, data, duration). View detection method Events: Examine the raw detection method events that contributed to the DoC for deeper insights into the specific network patterns. Timeline Analysis: Use the timeline view to visualize the sequence of events leading up to and following the DoC.
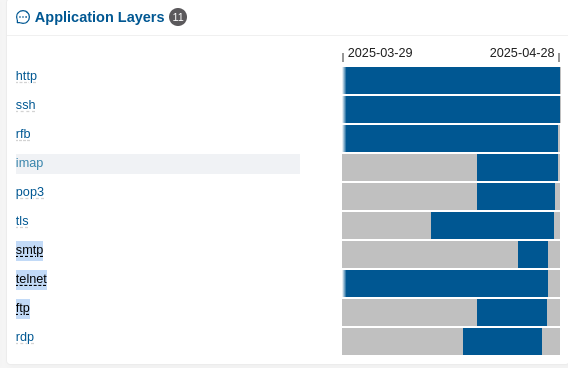
Review the Introduction fingerprint for that host, looking for unusual communication occurrences like application layer protocols, network services, HTTP user agents, SSH software, proxy services present and others.
AppLayer
Look for unusual unencrypted application layer services, like SMTP, TELNET, FTP, TFTP etc.
Services
Network services that the host offers should be reviewed for suspicious and anomalous behavior. For example:
Are the network services being served from that host expected ?
Are the services running on unusual ports?
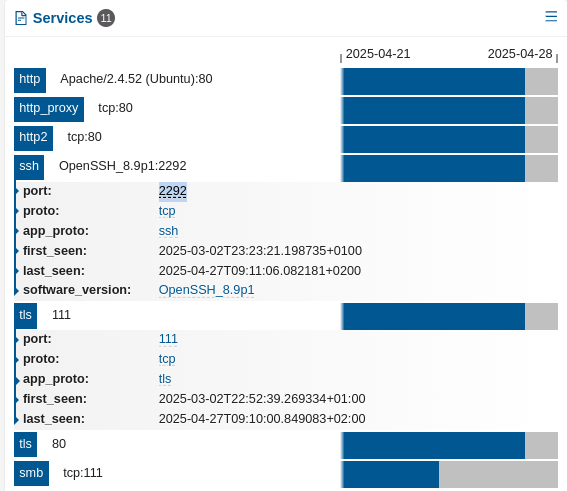
The example below shows unusual TLS and SSH services that were not expected to be found on a host using anomalous ports:
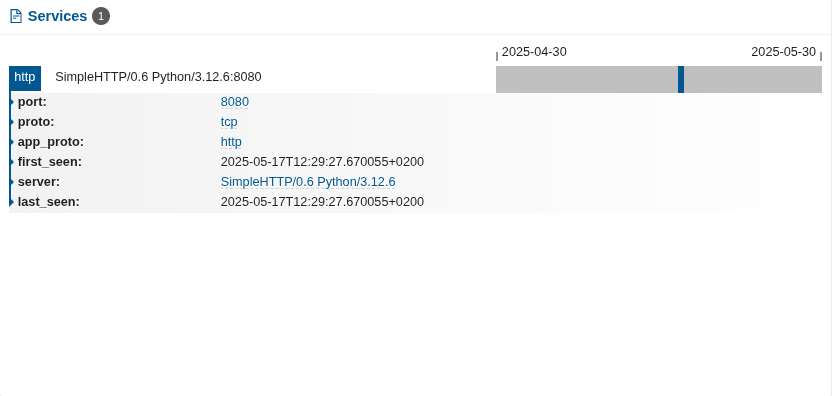
In another example, finding a suspicious anomalous service present on production infrastructure or desktop/laptop computers, like one line python/perl/go services would indicate a potential problem. In the example below we have a python network service present on a production server:
HTTP User agents
Look for the presence of any suspicious HTTP user agents.
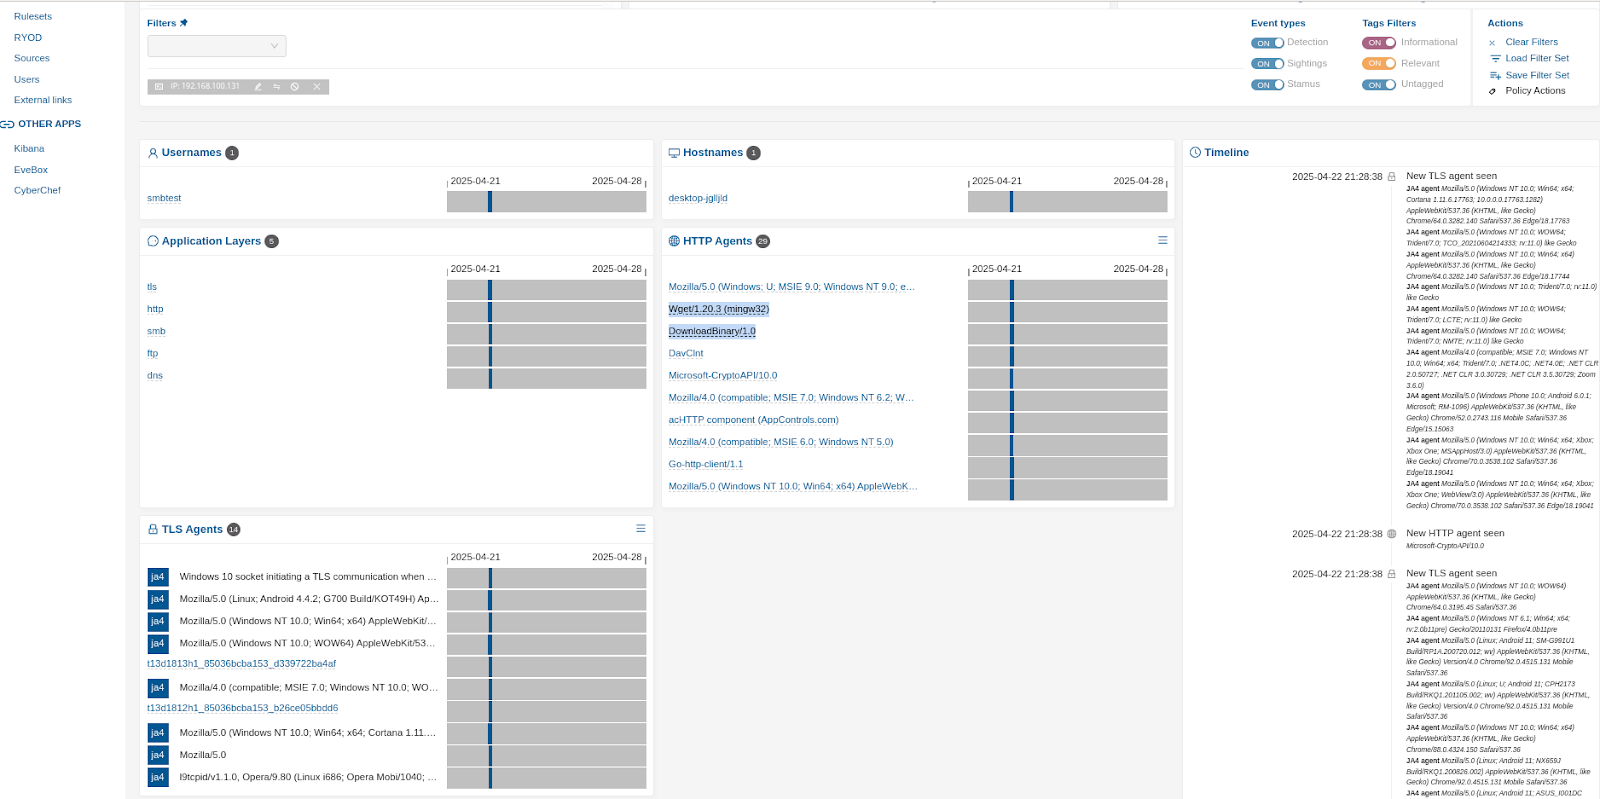
The example below shows a malicious HTTP user agent present on a Host.
SSH Client / Server software
Check for the presence of unusual SSH software being used from a Host.
Is this software expected or not?
Does it violate security policies?
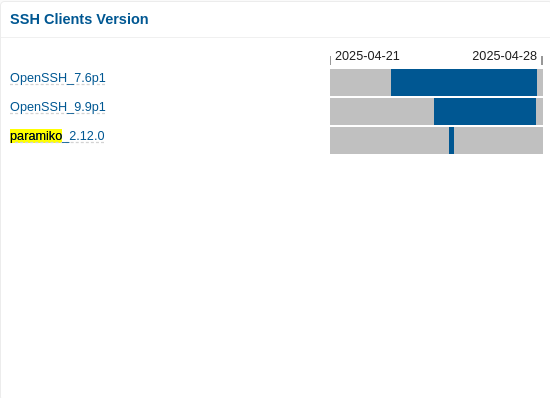
The example below shows the presence of programmable/scriptable SSH software on a host:
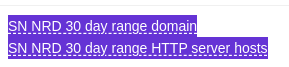
NRD
Check for Newly Registered Domains (NRD) accessed from that host. Those likely indicate suspicious unwanted, anomalous or malicious behaviour.
The example below shows a newly registered domain being accessed by malware on an infected host:
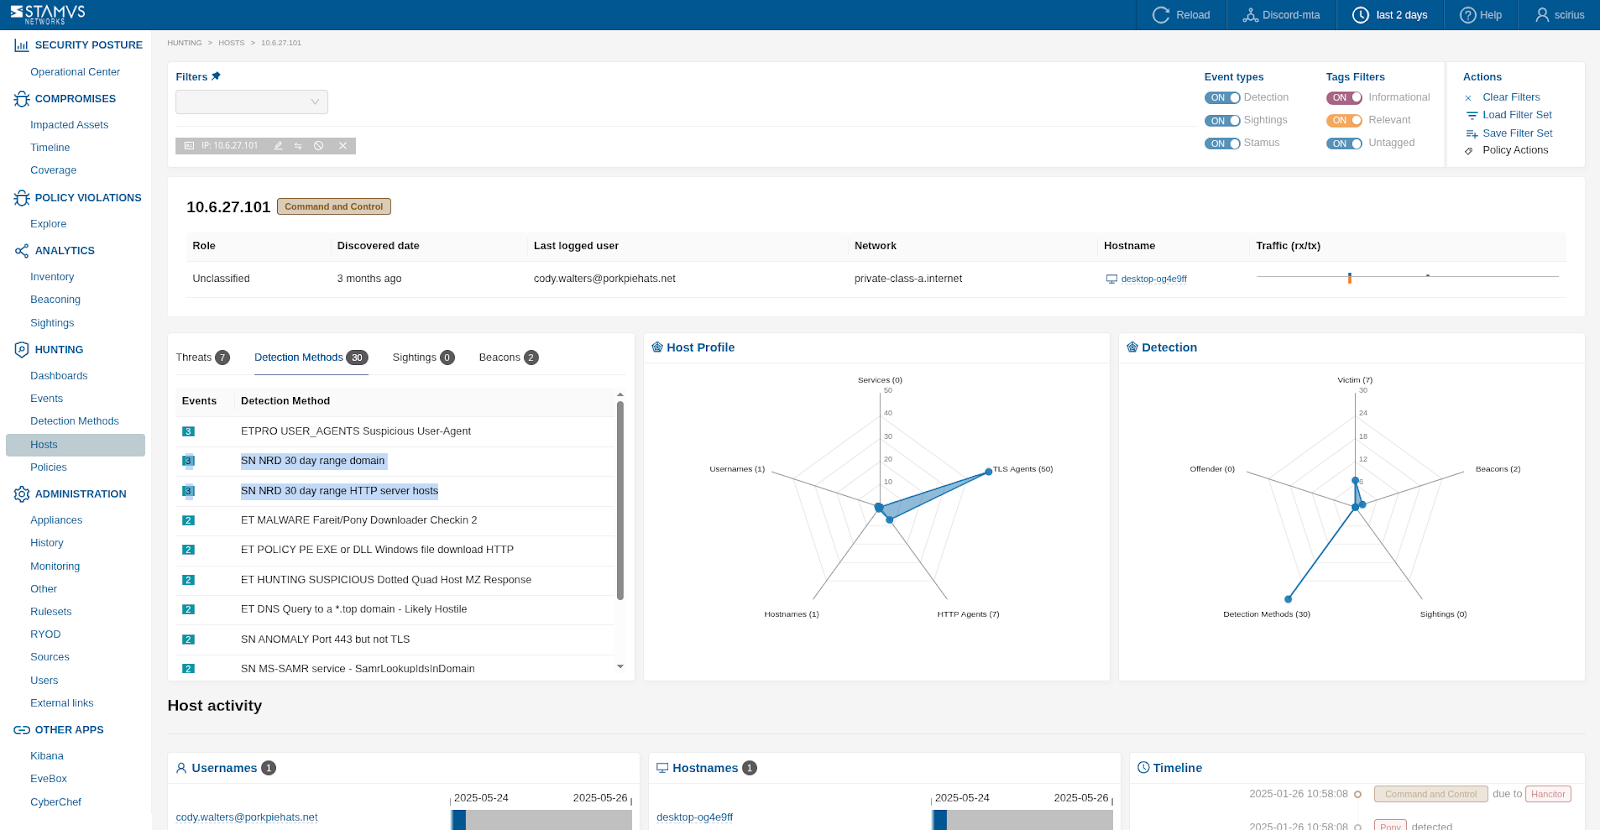
We zoom into the detection methods in the screenshot below:
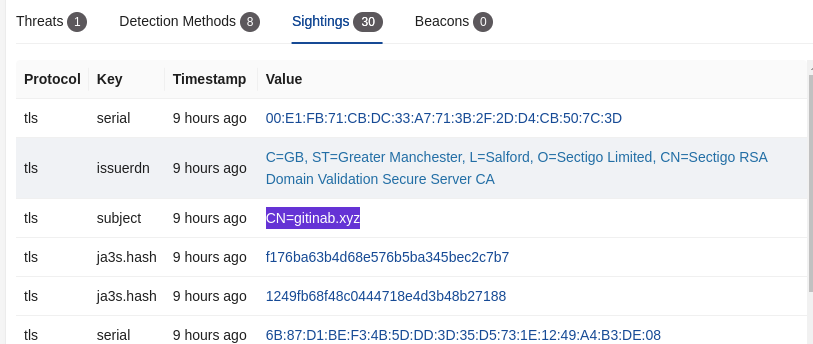
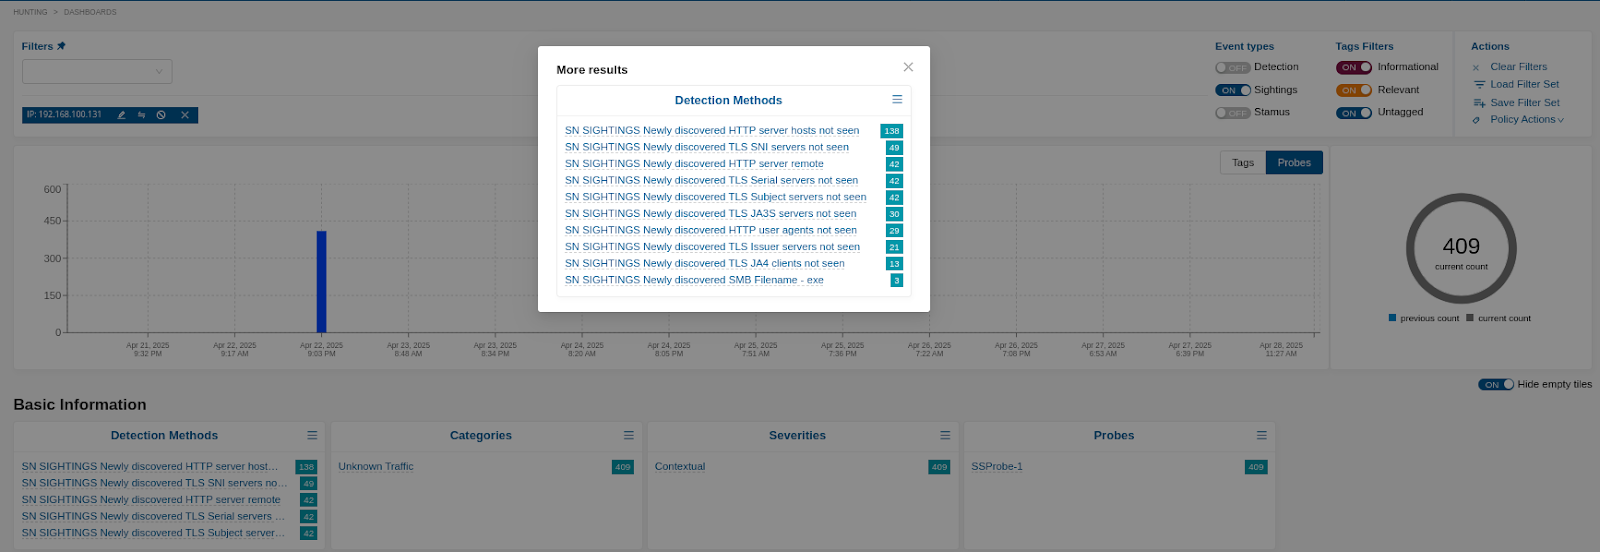
SIGHTINGS
Review the last 7-30 days for that host in the SIGHTINGS tab. Look for unusual domains, HTTP hostnames, TLS SNI names or SMB file transfers.
The examples below shows the first SIGHTINGS of a typosquatting-like TLS SNI used by malware on a host:
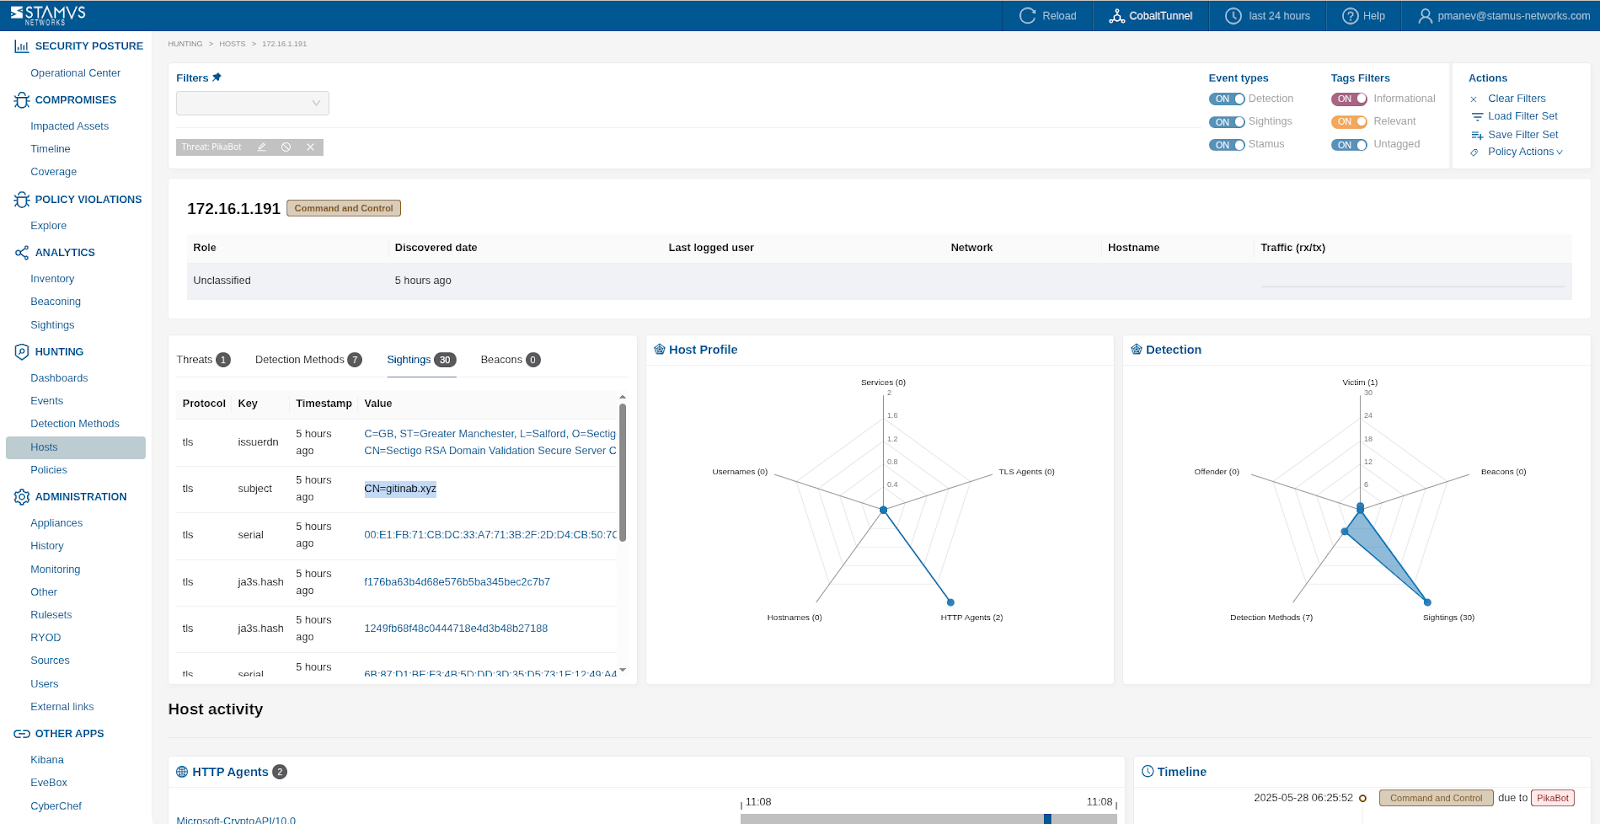
We zoom into the SIGHTINGS section in screenshot below:
Hunt Dashboard
Review the last 7-30 days for that host in the SIGHTINGS tab. Watch out for unusual domains, HTTP hostnames, TLS SNI names or SMB file transfers.
File transfers
Clear NDR will observe and detect file transfers that use the following protocols: HTTP, HTTP2, SMB1, SMB2, SMB3, FTP, TFTP, NFS
In the Hunting > Dashboards look for file transfer to/from that Host/IP. Take note of any executables that are unexpected or transferred in clear text.
The screenshot below shows file transfers detected for a specific host, using a MIME filter and a specific IP:
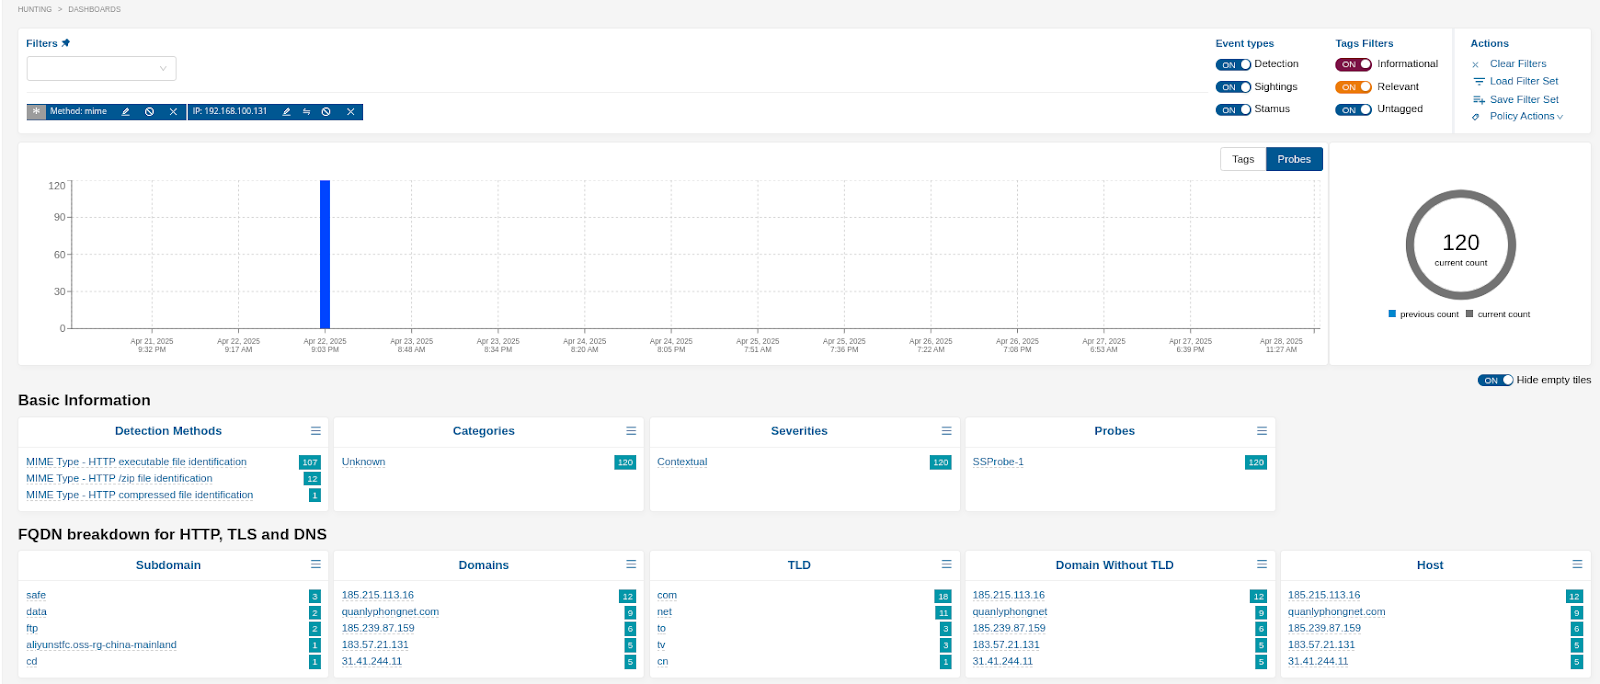
Note
For MIME file transaction detection events, the File MIME Identification detection ruleset must be enabled.
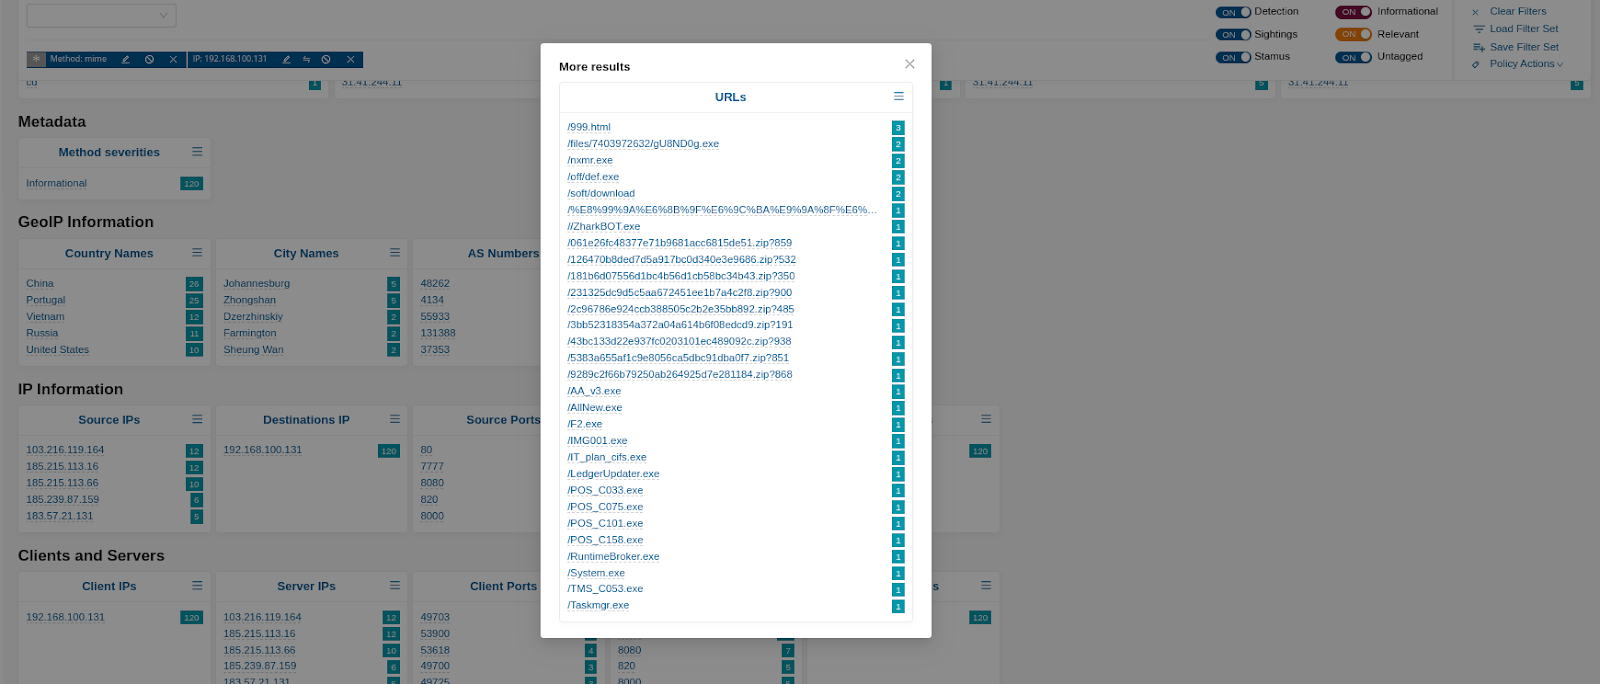
As a sequence of the above filter, the screenshot below lists HTTP URLs and filenames transferred associated with that host over the selected timespan.
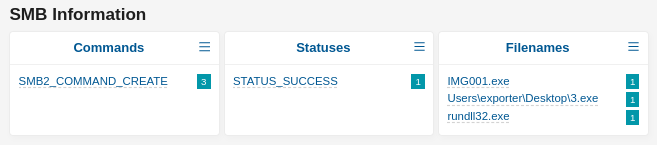
The example below shows anomalous and malicious file transfers over SMB as a subsection of the results of the same filter in the 2 screenshots prior:
Lateral Movement
An example of real world routine can also be reviewed at this blogpost Hunting for Lateral Executable Transfers
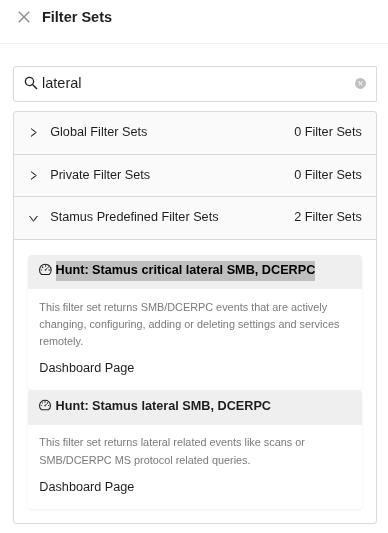
Review for any possible (Windows AD based) lateral movement initiated from the host, and evaluate if any specific critical lateral changes are expected from that host. To do that select the Critical Lateral SMB hunting filter:
Add the Host IP:
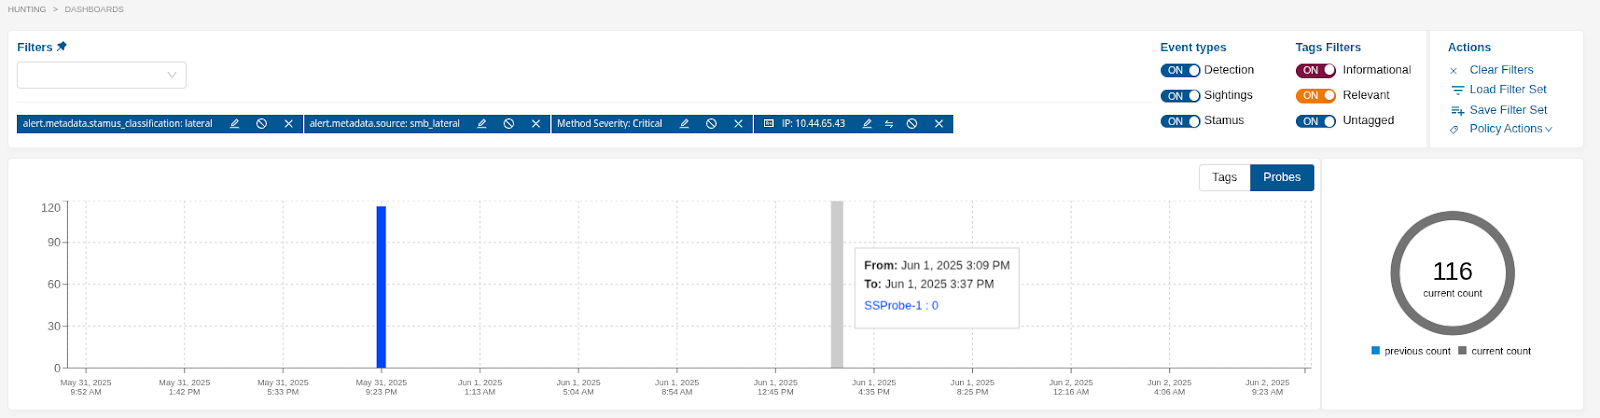
Evaluate if that host is expected and allowed to make those changes remotely.
Remote Administration
Remote administration in Windows AD environment can be observed and detected via 2 specific filtersets:
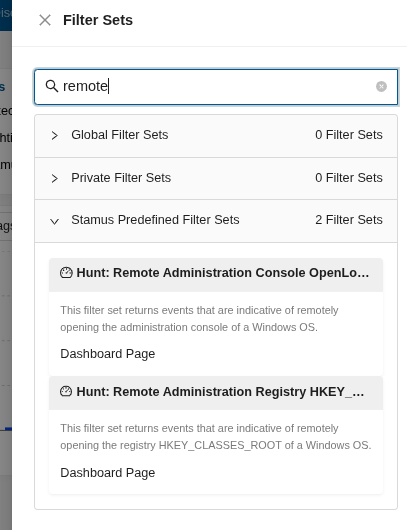
When selected, the first filterset (*Hunt: Remote Administration Console OpenLocalMachine*) displays when the Open Local Machine console is remotely opened for administration:
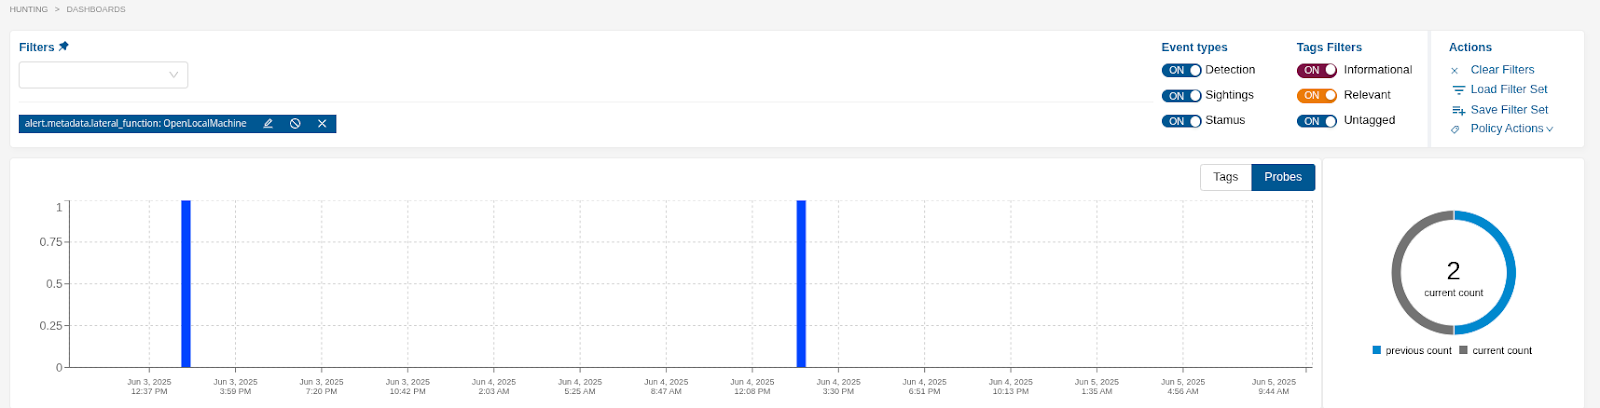
Evaluate and investigate if the host is involved in remote administration activities and if this is expected and/or from expected locations.
Expanding Investigations from DoCs
Objective: Deepen the understanding of likely compromises and identify any related or lateral movement activities, determining the blast radius of the attack.
Methods:
Temporal Analysis: Examine network traffic and events surrounding the timeframe of the DoC. Look for any unusual activity before, during, and after the declared compromise. * Navigate to the Timeline page under Compromises in the UI. Identify any lateral movements between likely-compromised hosts. Identify any changes in the kill chain phase for a threat.
Host-Centric Analysis: Focus on the compromised internal host(s). Investigate their communication patterns, DNS queries, HTTP requests, file transfers, and any other relevant network behavior. Look for connections to new or unusual external IPs/domains. * Navigate to the detailed host page, look for all IDS events and Stamus threats related to that host. * Look at the last logged in users to determine potentially compromised accounts.
Protocol-Specific Analysis: If the DoC involves a specific protocol (e.g., suspicious DNS), dive deeper into the related protocol traffic to identify the hosts involved. Look for anomalies or indicators of abuse.
User-Centric Analysis (if applicable): If the compromised host is associated with a specific user, investigate their recent network activity for any other suspicious behavior. As shown in the screenshot below, it is very easy to pivot from Host- to User-centric analysis by simply selecting the username from within Host Insights:
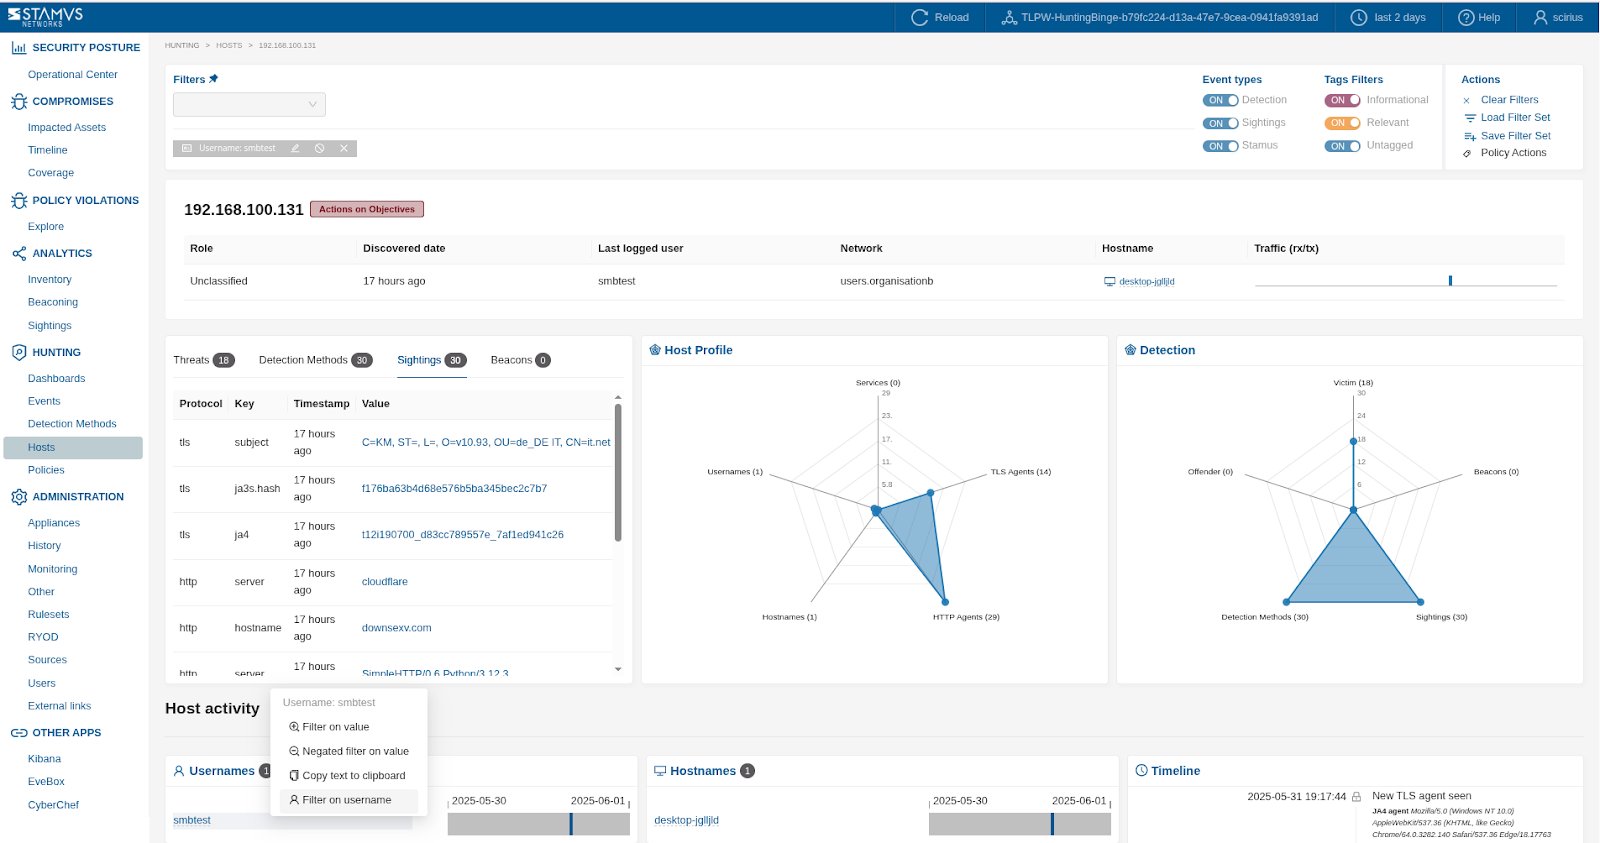
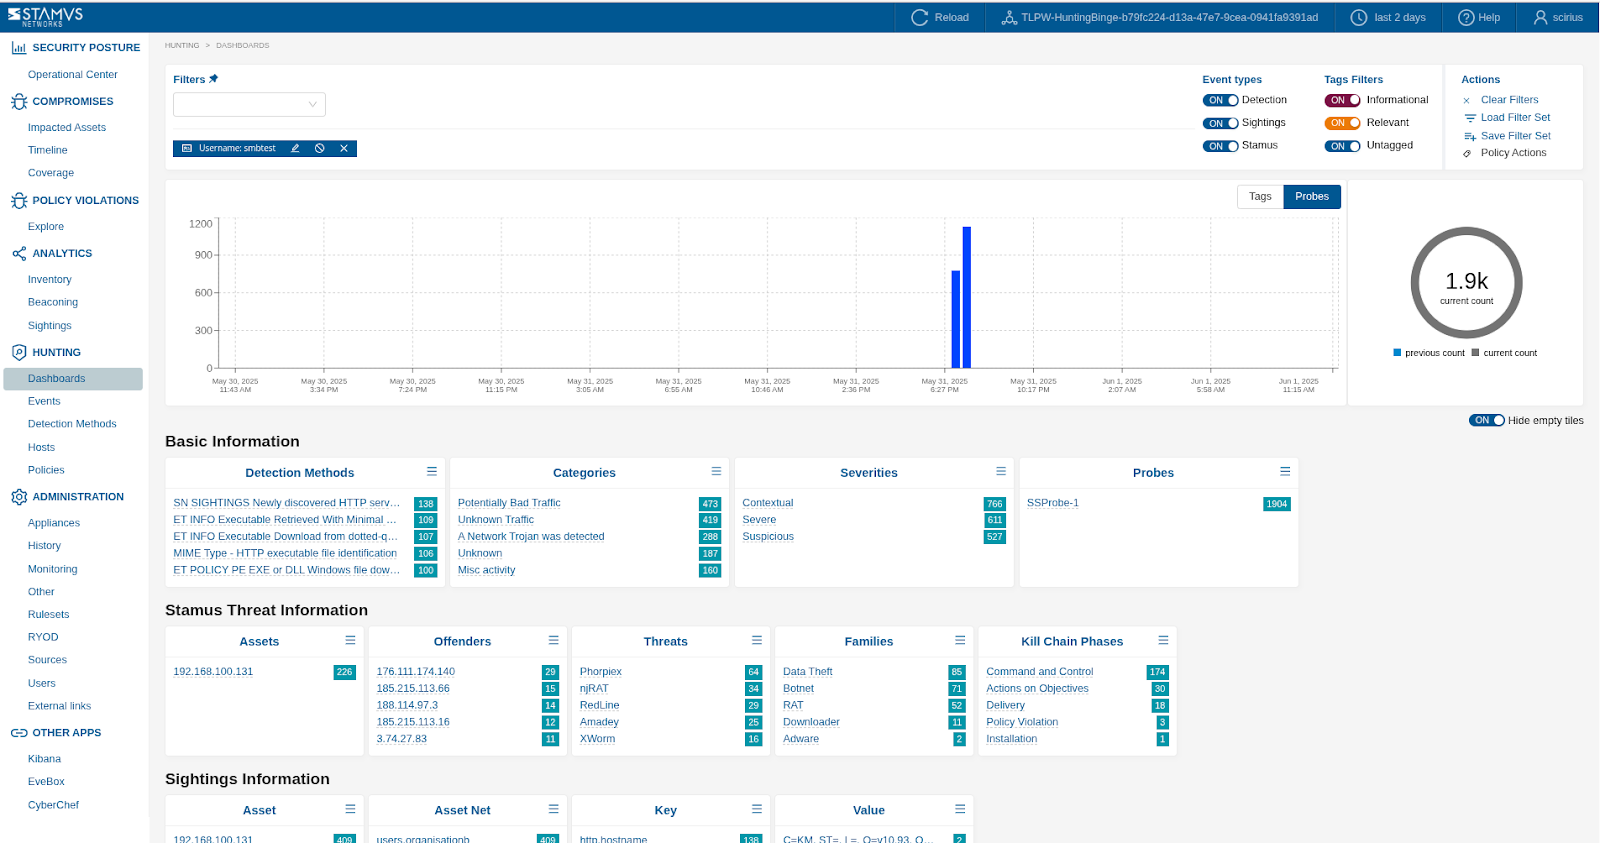
To review detection events associated with a host that this user has been seen logging into, pivot to Hunting -> Dashboards after selecting the username:
Lateral Movement Detection: Look for network connections originating from the compromised host to other internal hosts that are not part of its typical communication patterns. Investigate authentication attempts, SMB/CIFS activity, and other signs of lateral movement.
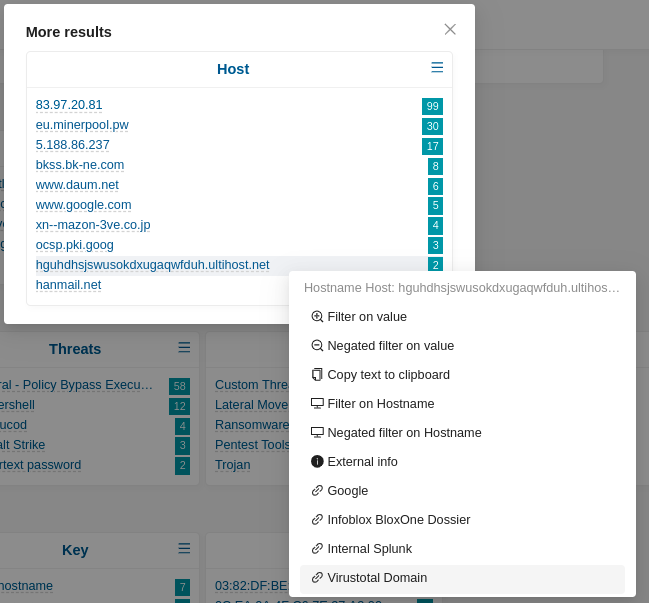
Investigate specific metadata: If you wish to determine where in the network a specific piece of metadata has been observed and from what hosts, this can be easily achieved with a single click on the Host Insights page.
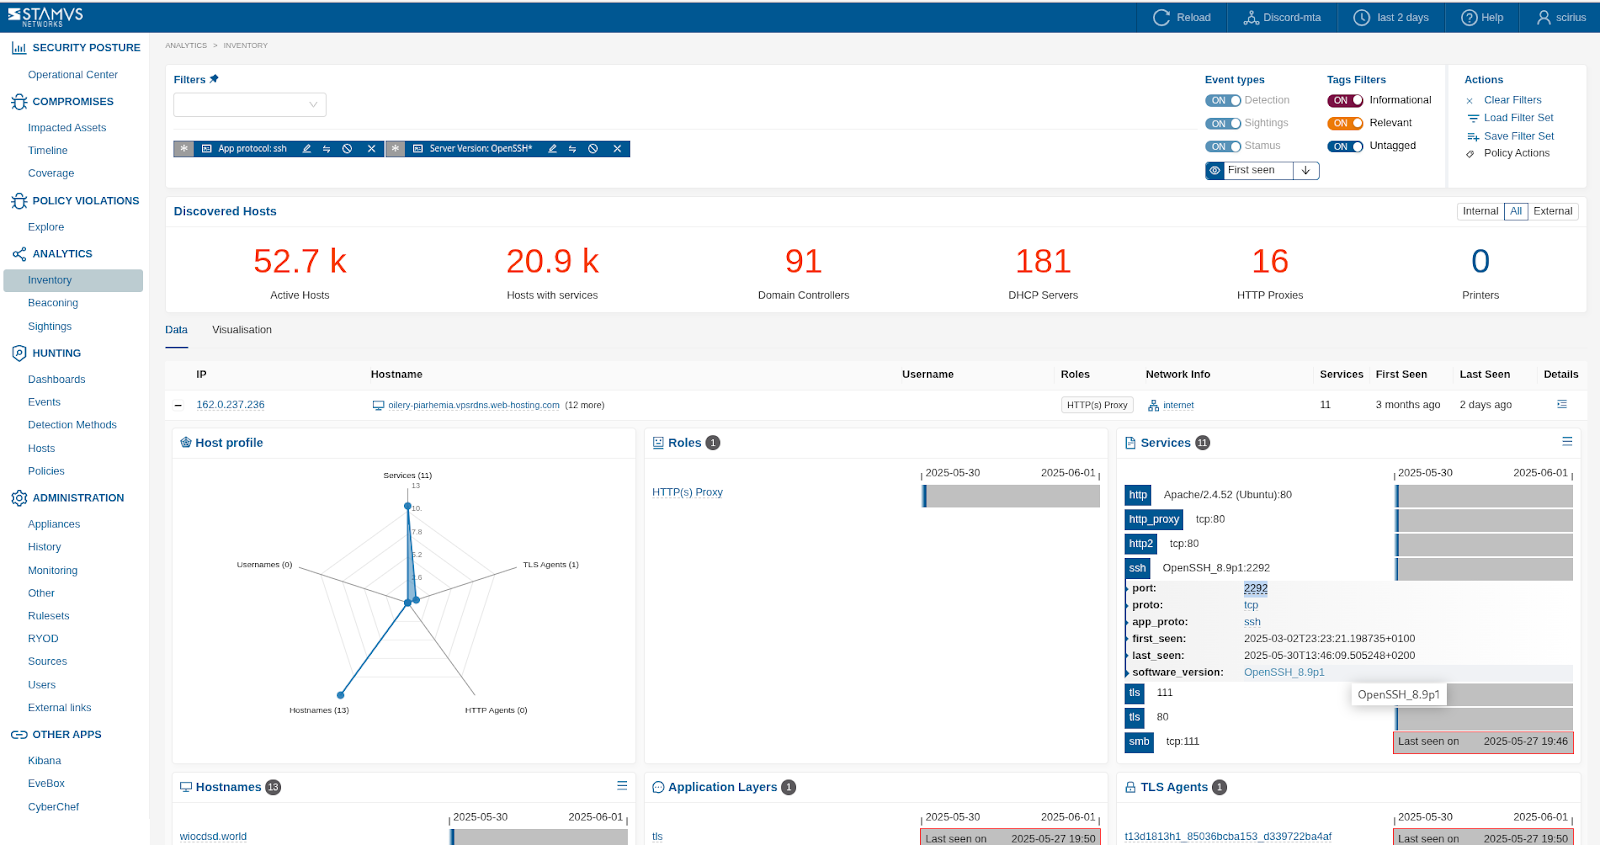
The example below shows a search in the
Inventorypage for any hosts that uses has SSH server deployed on as a service and is using***OpenSSH***(wildcard) SSH version:
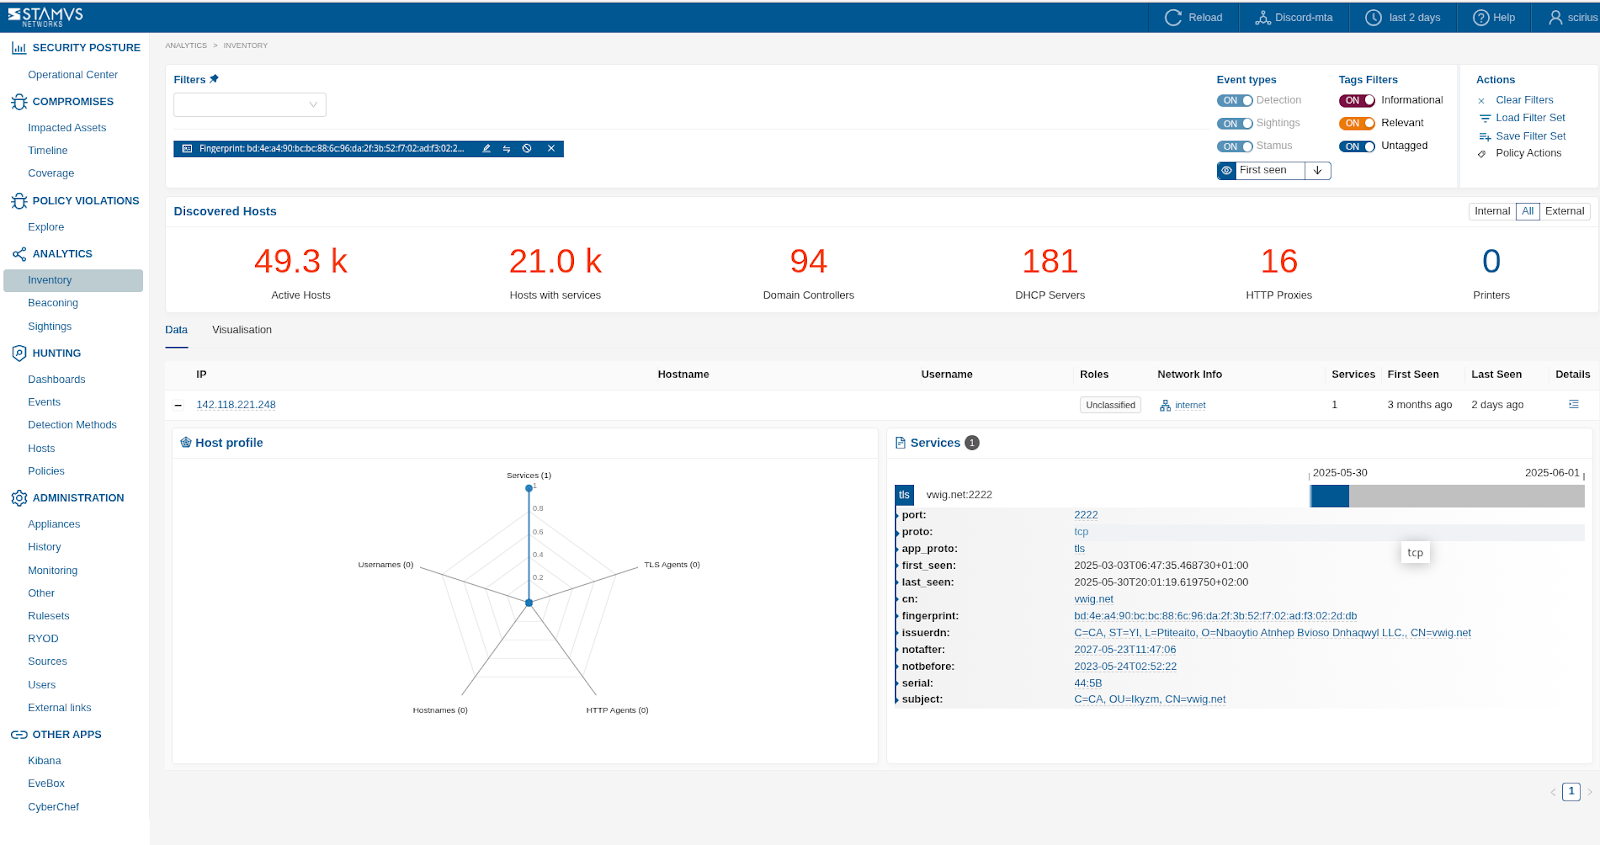
Another example - shown below - illustrates a search in the Inventory page for any hosts that use a specific TLS fingerprint certificate:
Leveraging Clear NDR Features for Enhanced Hunting
Throughout the investigation, you may use the following Clear NDR features:
Events category: review the most frequent threat categories.
Beaconing: Analyze the output of the beaconing part of the hunting UI. Review each potential attacker IPs and analyse the events triggered by those.
Deep Linking: use Clear NDR External Links Templates capabilities to quickly access more insight from a third party tool (such as an EDR or Inventory system):
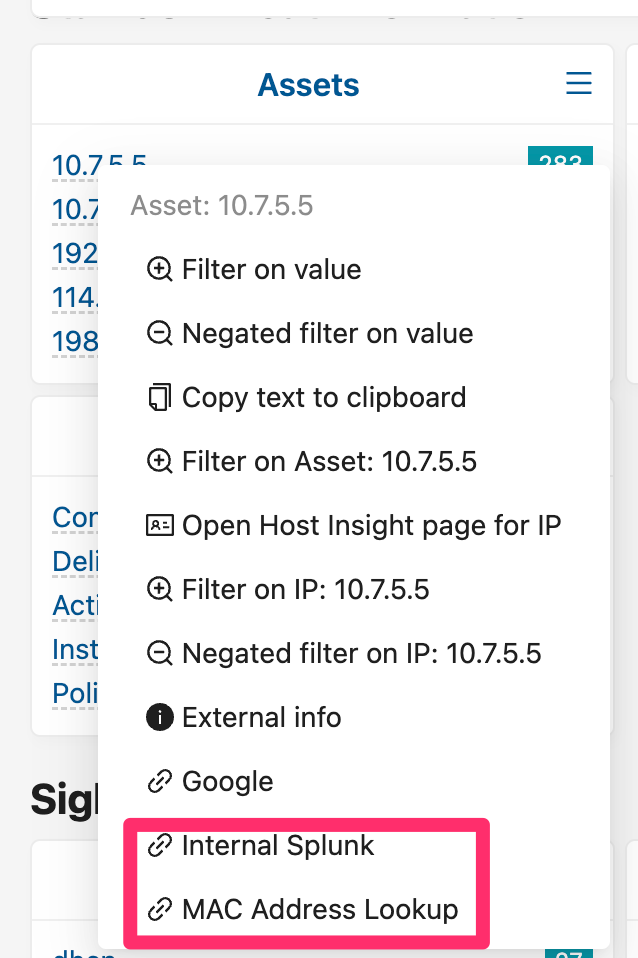
This external linking functionality is quite flexible and customizable. It can be used to access multiple external tools or systems. See examples in the screenshot below: