
Warning: You are viewing an older version of this documentation. Most recent is here: 42.2.0
Security Posture
The Security Posture is the place where high level dashboards are available both for Operational and Management needs.
Operational Center
The Operational Center has been designed for SOC Operations and Security Analysts to have a simple and comprehensive dashboard about the state of the threats in their environments.
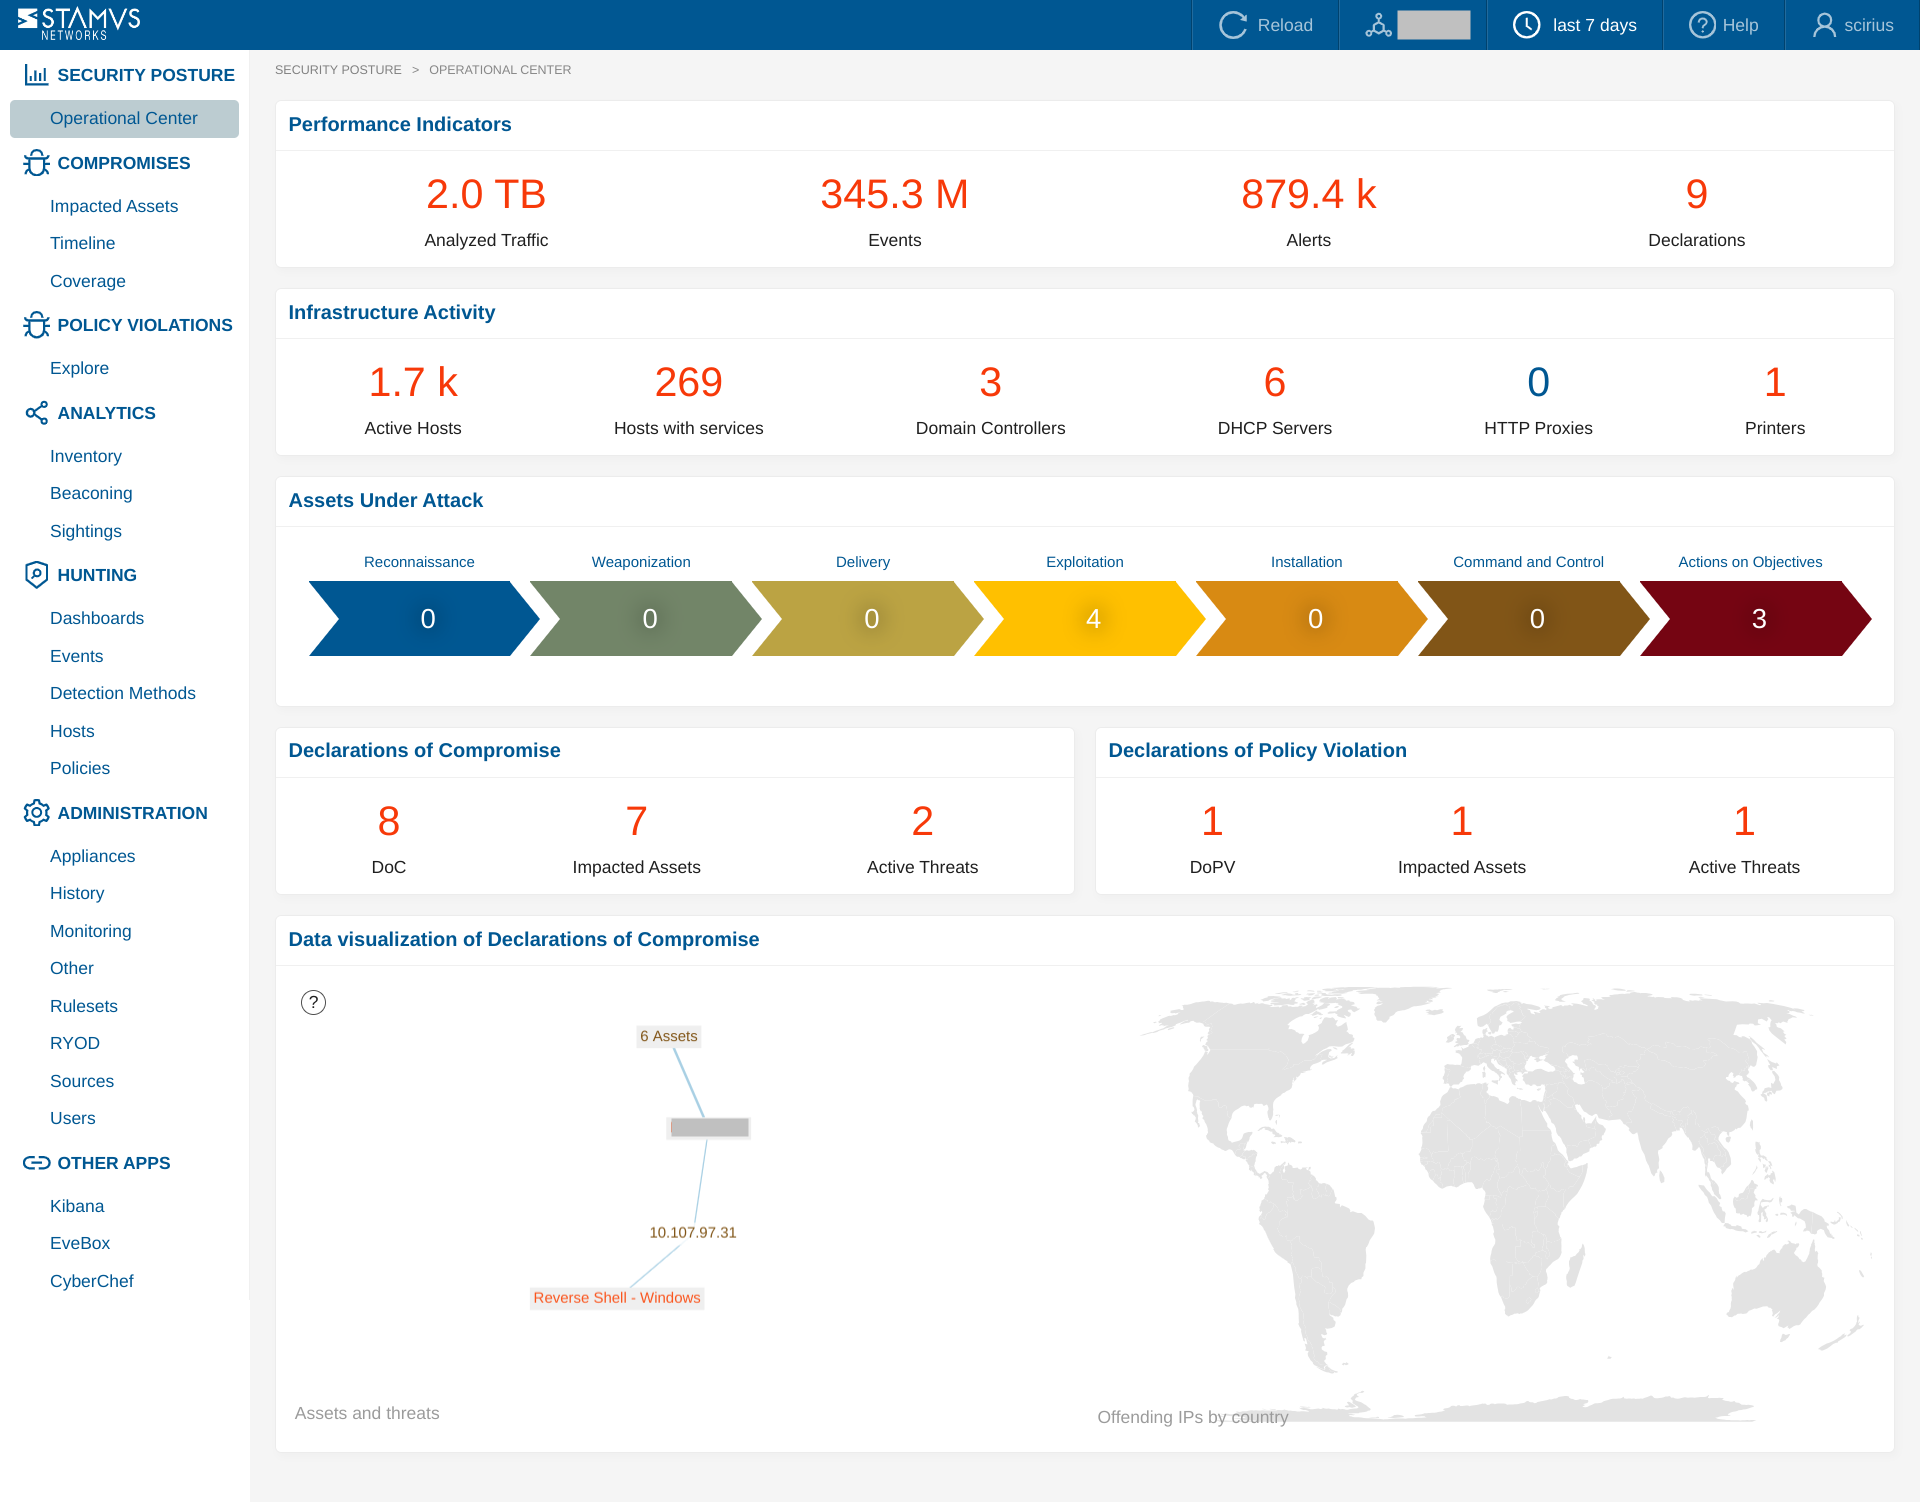
As only Declarations of Compromise ™ are escalated to this dashboard, most of these KPIs will be at 0 most of the time. And that’s a good thing, translating a healthy environment!
From top to bottom, this dashboard presents:
Technical KPIs
Performance Indicators
Total analyzed traffic - represents the volume of network traffic analyzed by the Stamus network probes over the displayed period
Total events processed - represents the count of protocol transactions and alerts analyzed by the Stamus network probes over the displayed period
Total number of alerts - represents the count of IDS alerts created by the Stamus network probes over the displayed period
Total Declarations of Compromise - represents the total count of Declarations of Compromise and Declaration of Policy Violation discovered by Stamus Central Server over the displayed period
Total impacted assets
Total active threats
Infrastructure Activity
Total Active Hosts - represents the total volume of hosts that are part of the network
Total Hosts with services - represents the total volume of hosts that have at least one service running
Total Domain Controllers - represents the total volume of hosts that are running a domain controller service
Total DHCP Servers - represents the total volume of hosts that are running a DHCP server service
Total HTTP Proxies - represents the total volume of hosts that are running an HTTP proxy service
Total Printers - represents the total volume of hosts that are printers
Assets Under Attack
The state of each impacted asset on the Cyber Killchain
Declarations of Compromise
Total DoC - represents the total count of Declarations of Compromise discovered by Stamus Central Server over the displayed period
Total Impacted Assets - represents the total count of assets involved in Declaration of Compromise over the displayed period
Total Active Threats - represents the count of unique Threats active over the displayed period
Declarations of Policy Violation
Total DoPV - represents the total count of Declaration of Policy Violation discovered by Stamus Central Server over the displayed period
Total Impacted Assets - represents the total count of assets involved in Declaration of Policy Violation over the displayed period
Total Active Threats - represents the count of unique Threats active over the displayed period
A direct graph of the Declarations of Compromise (Assets and Threats)
A Geographical map of the threats (Offending IPs by country)
This dashboard is only available to Stamus NDR users.
See also
Wondering what a Declaration of Compromise ™ is? Check this page Declaration of Compromise
See also
Wondering what a Declaration of Policy Violation ™ is? Check this page Declaration of Policy Violation®