
Warning: You are viewing an older version of this documentation. Most recent is here: 42.2.0
Declarations of Compromise
Note
Declarations of Compromise were formerly known as STR Events prior U38.0.0
See also
If you want to know more about Declarations of Compromise ™, read this page.
Declarations of Compromise (DoC) Overview and Key Features
Coverage Page
The Coverage page provides a comprehensive view of all active Declarations of Compromise within your system.
Threat Families Overview:
Displays categorized threat families (e.g. APT, Ransomware), allowing users to see the different types of threats being monitored.
Threat Metrics:
Each card shows metrics such as:
New Offenders: Number of newly detected entities acting as offenders.
New Victims: Number of newly detected impacted entities.
Covered Threats: Total threats identified within each family.
Detection Methods: Number of detection methods used for identifying threats.
These metrics help prioritize which threats need immediate attention.
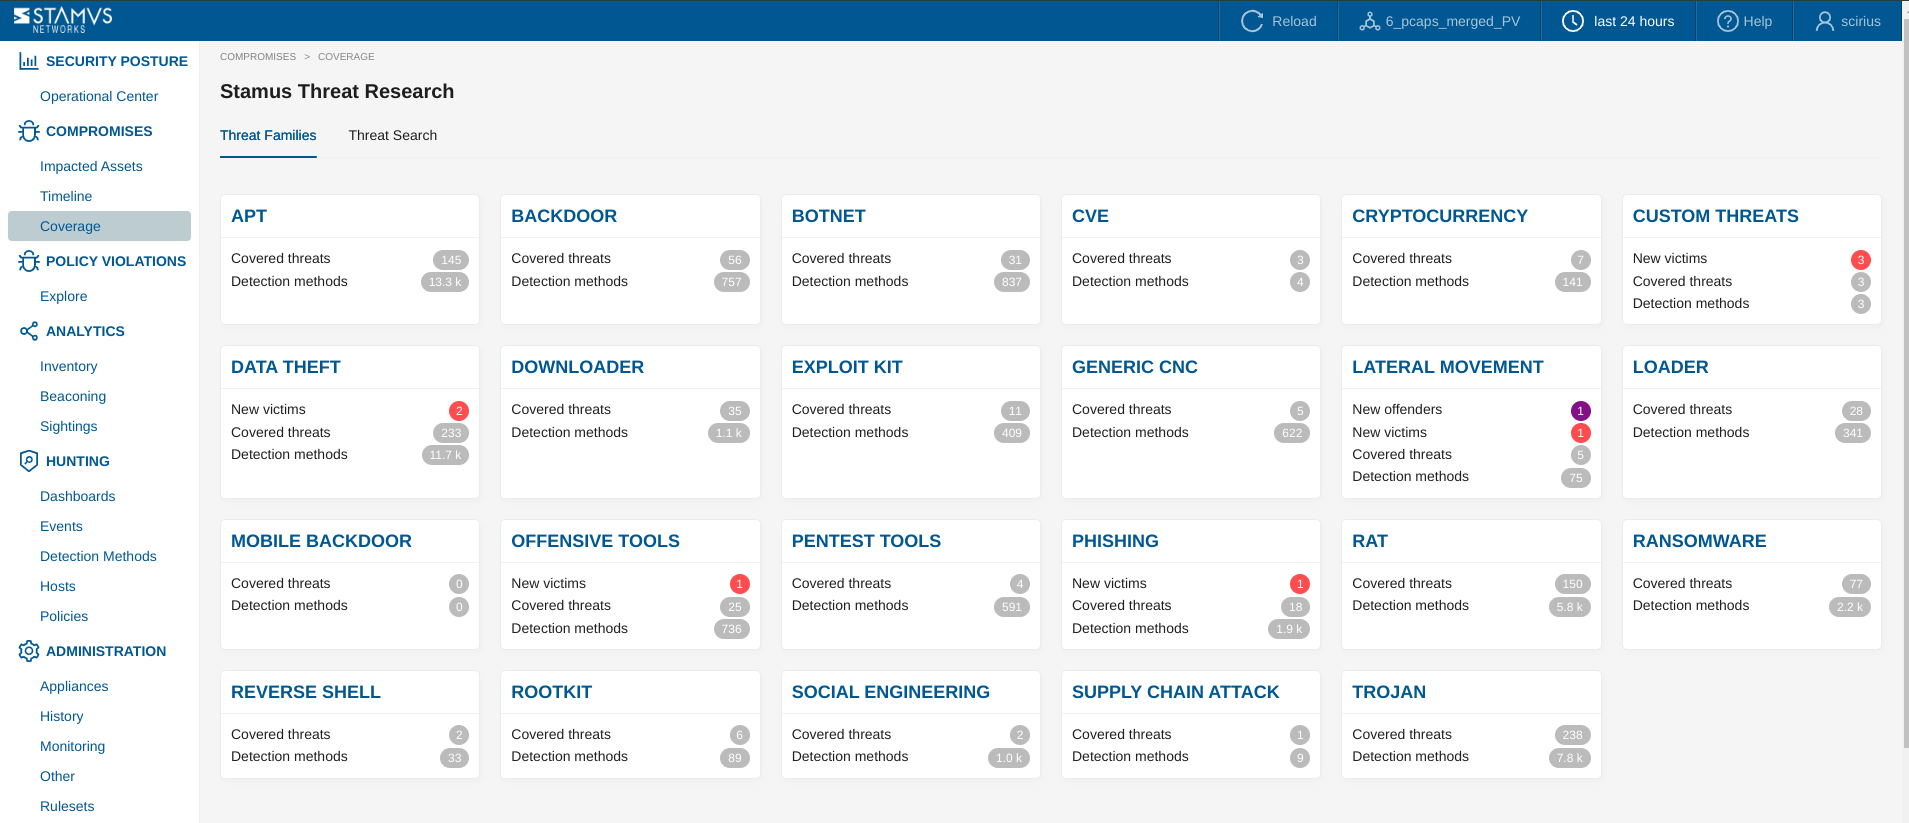
The Coverage page provides actionable insights, facilitates assessing threat detection coverage and identifying areas needing additional focus.
In addition to that, Coverage page provides a detailed snapshot of your network’s threat landscape, aiding in effective monitoring and management of security threats.
Threat Family Page
By clicking on a threat family name (from Coverage page), you are redirected to the relevant Threat Family page.
This page provides a detailed view of a specific Threat Family. It includes an overview of active threats associated with the selected threat family, helping in understanding the distribution and stage of each threat.
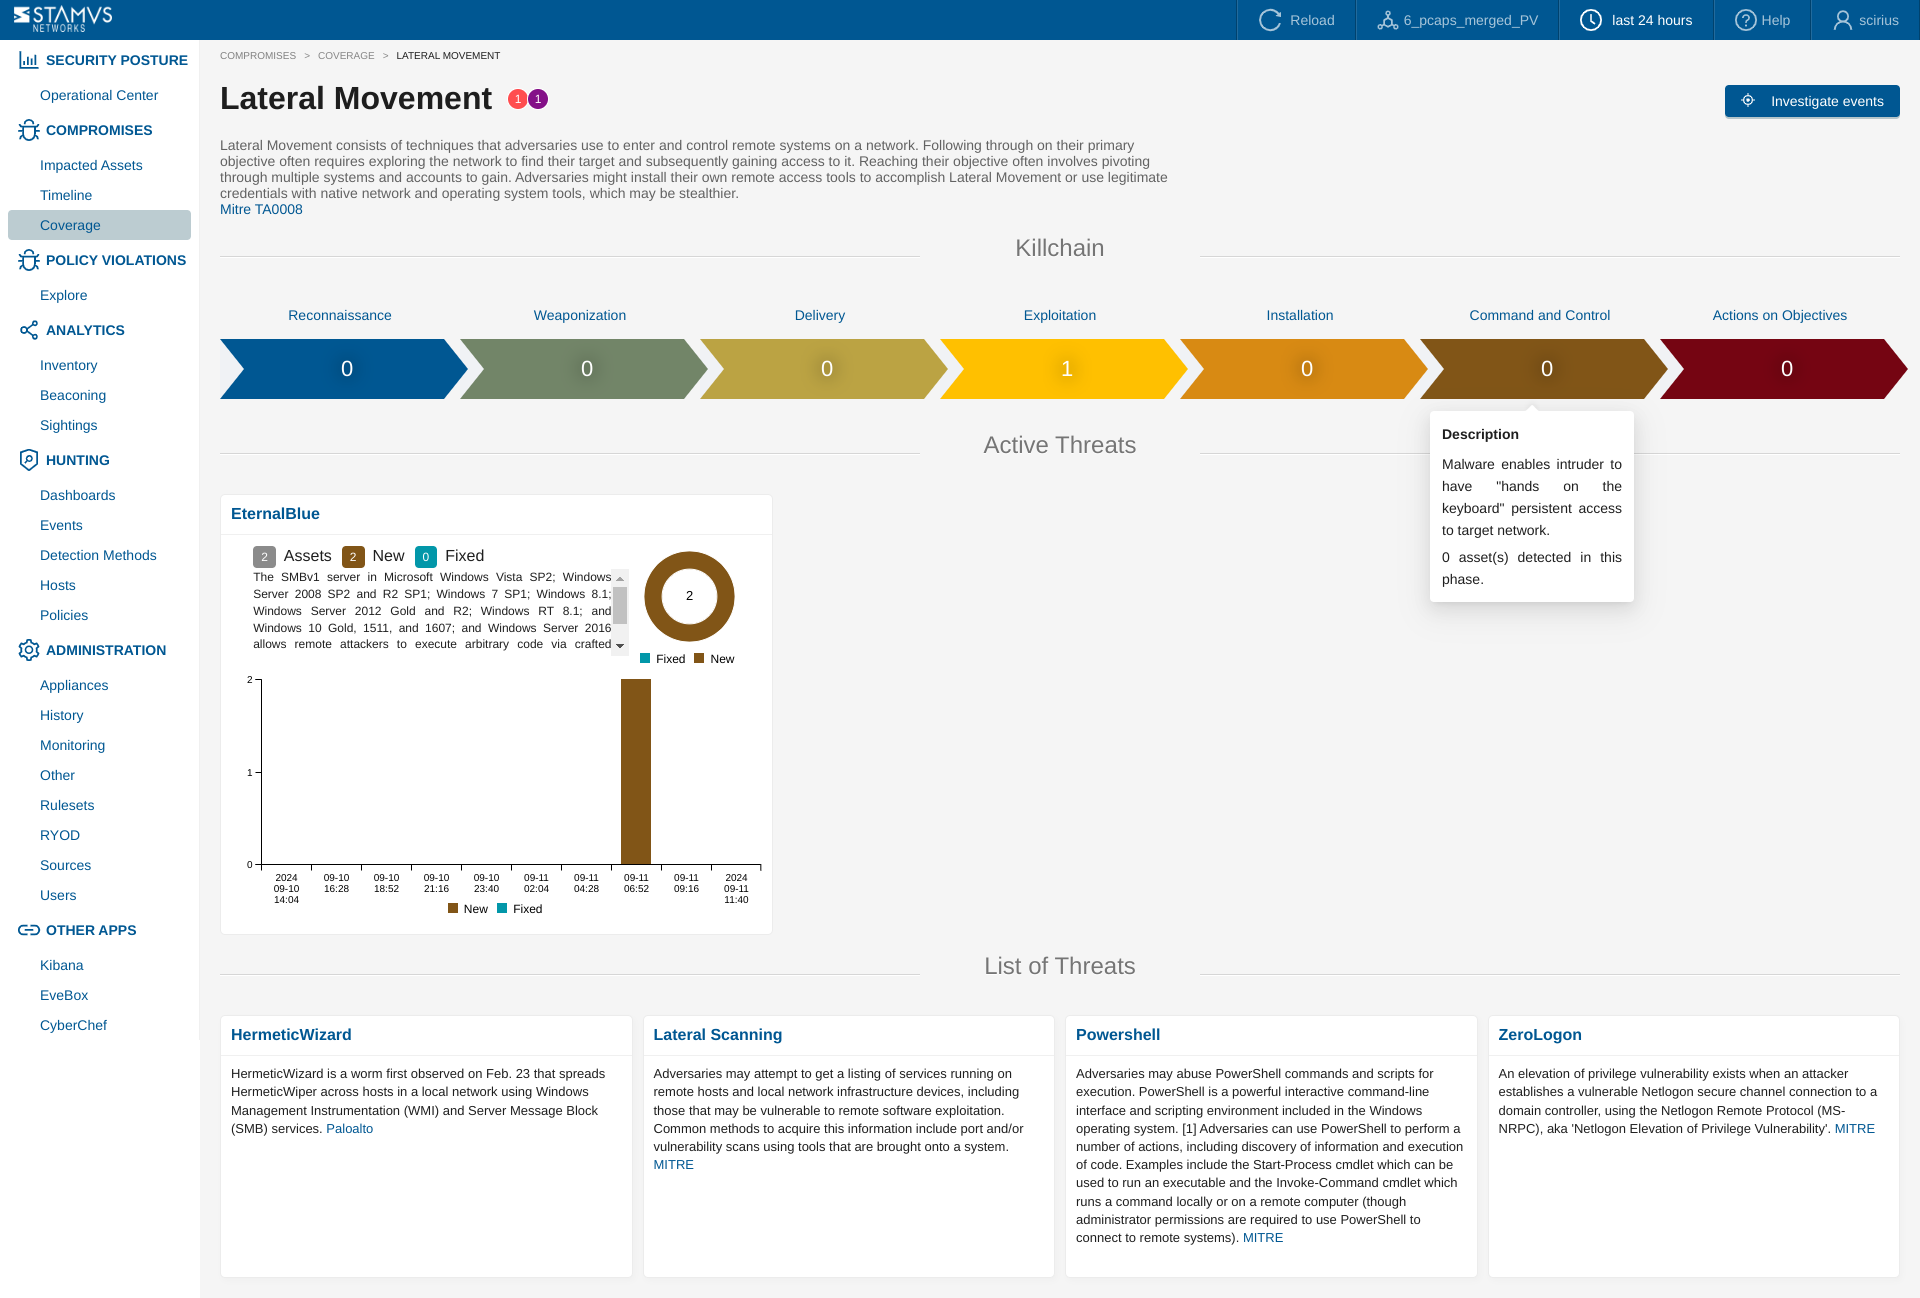
Key Components:
Kill Chain Visualization: Shows the distribution of detected threats across various phases of the cyber killchain. This helps you identify at which stage each threat is currently active.
Active Threats: Highlights the number of active threats, including new and fixed ones, providing an at-a-glance status update of threat activities within this family.
List of Threats: Offers detailed descriptions of individual threats within the selected threat family.
Timeline graph and Pie chart Represent the timeline of detected threats and show the number of new and fixed assets over time, helping to visualize the activity and progress of the threat.
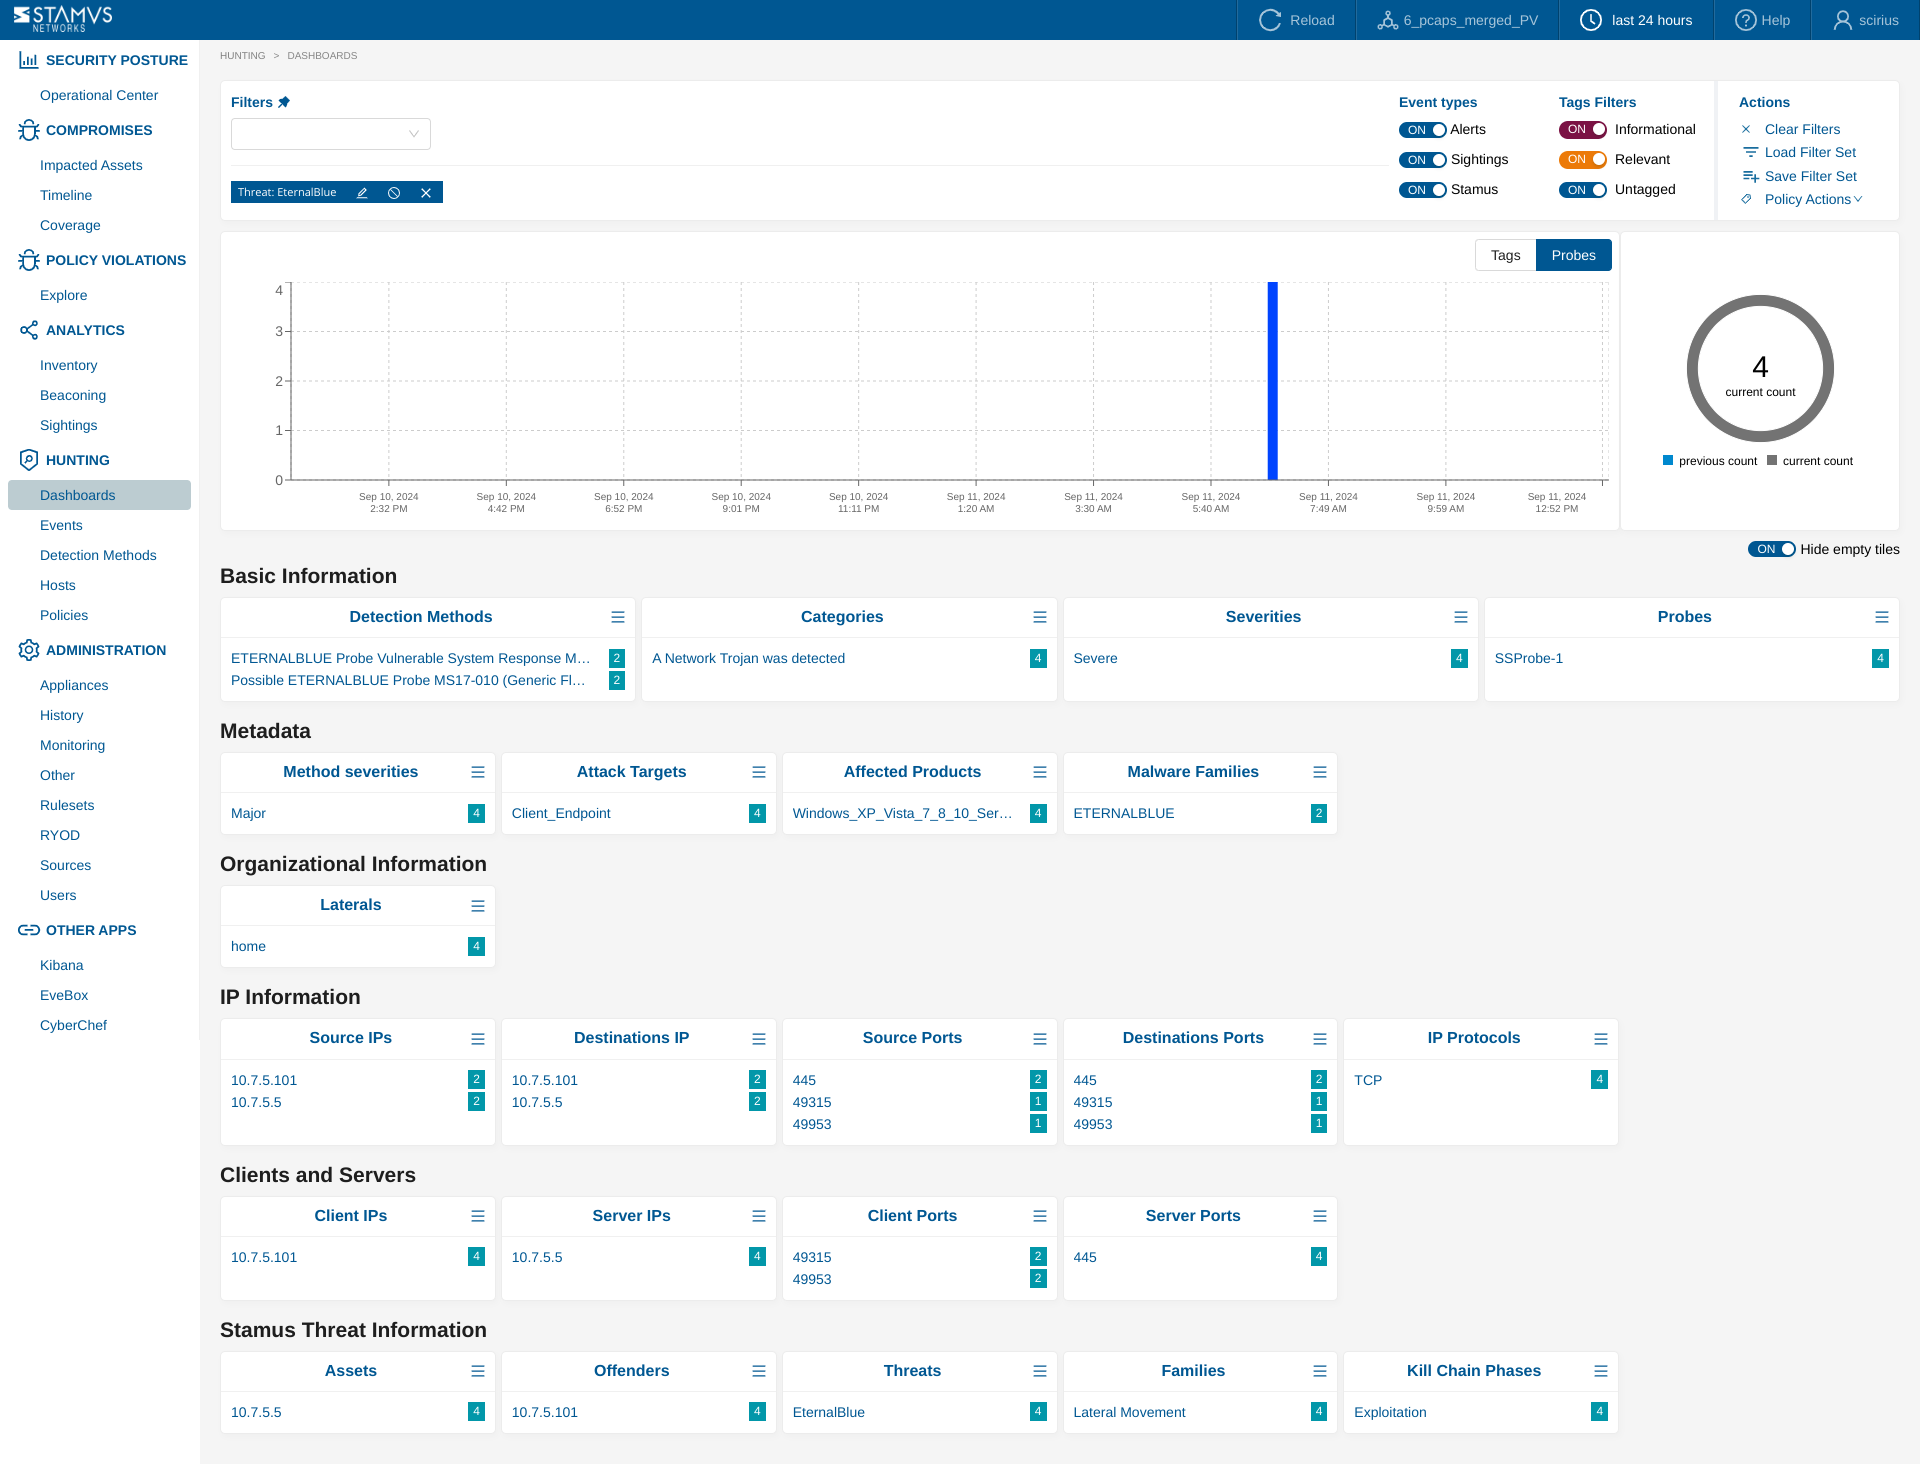
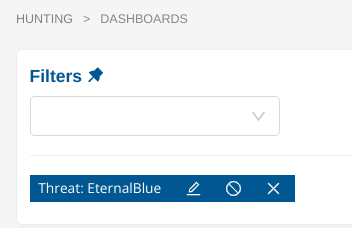
Investigate Events Button: Allows users to further investigate specific threat events to analyze evidence, understand threat patterns, and take appropriate response actions. To use this feature:
clicking on the Investigate Events button would automatically apply a filter on Threat Family name
you will be redirected to the Dashboards page where you will be able to see all relevant information to this Threat Family
you can navigate to specific pages like Hosts, Events or Detection Methods for further investigation and targeted actions. Also available in the Events page are the evidence logs and data that can include any related flow records, anomalies, alerts, protocol transactions, and file transaction logs, plus file extraction, packet capture (PCAP) and the detection logic of a specific event.
This page aids monitoring and managing threats related to a specific threat family, enhancing their ability to effectively respond to potential security incidents.
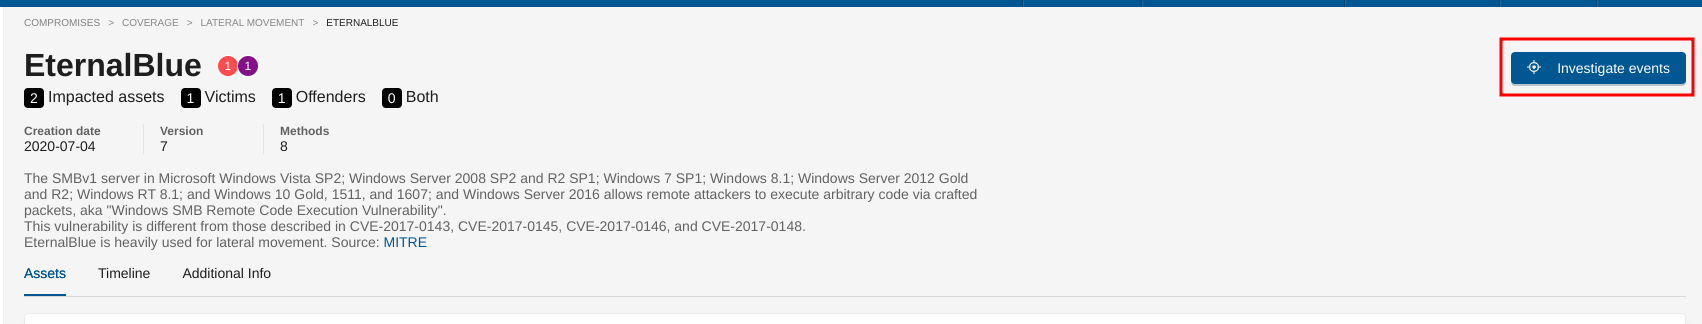
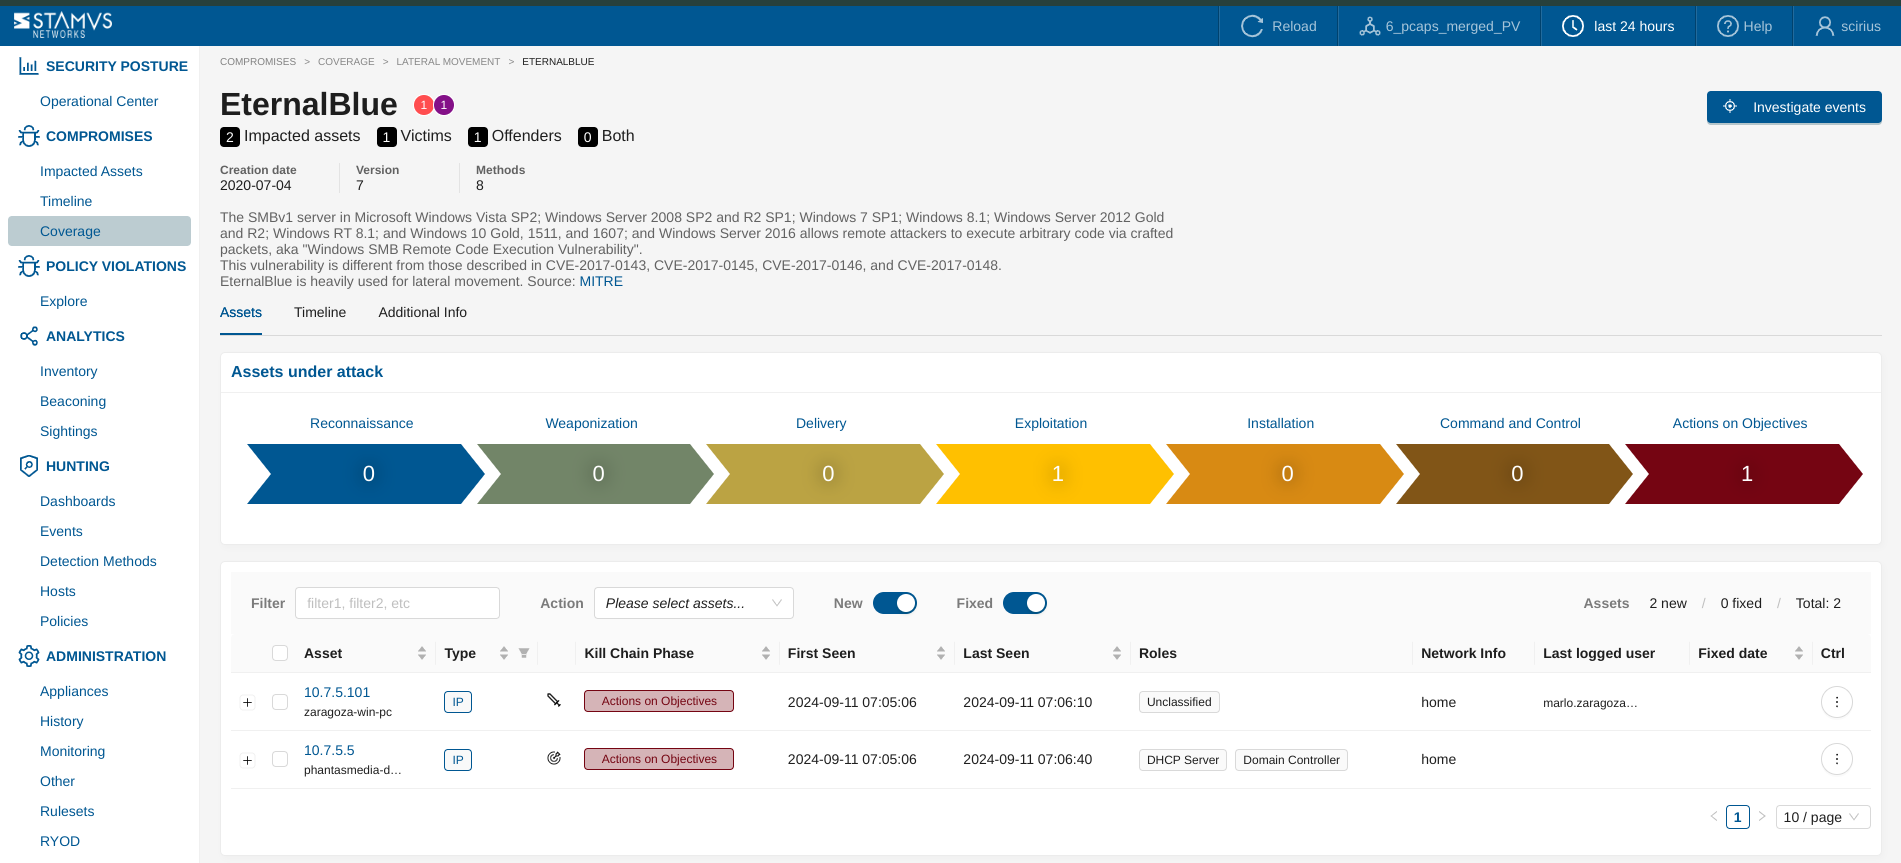
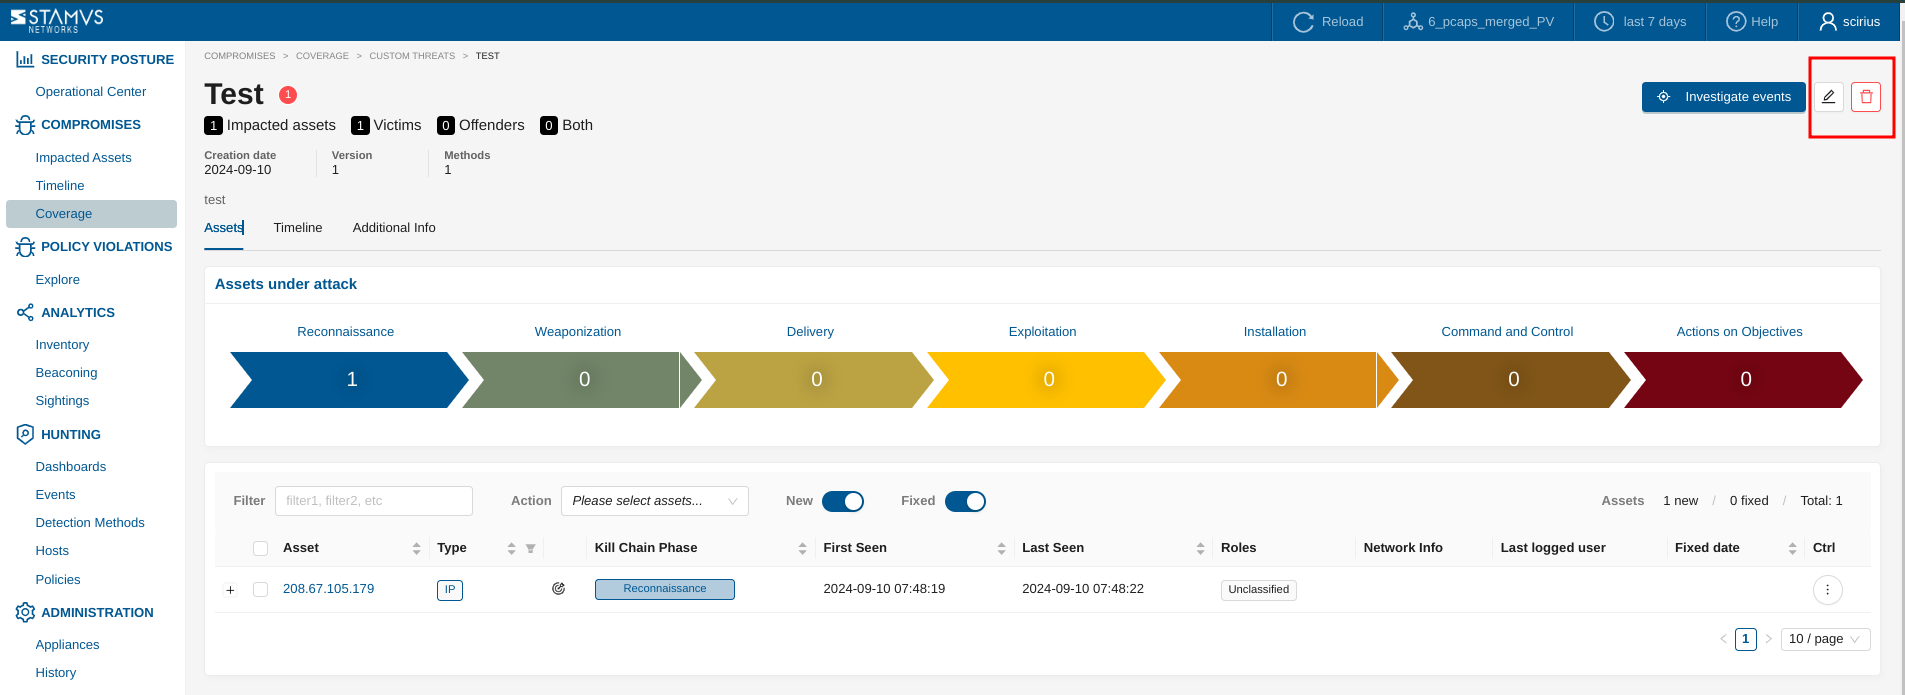
Threat Page
The Threat Page provides a detailed view of a specific threat detected within your network. It helps gain understanding about the threat’s behavior, associated assets, and its progression through the cyber killchain.
Key Components:
Threat Overview:
Displays essential information about the threat, including its name, creation date, version, and the number of detection methods associated with it.
Provides a description of the threat, outlining its behavior, typical attack vectors, and related malware or techniques. Links to external resources such as MITRE are included for additional threat intelligence.
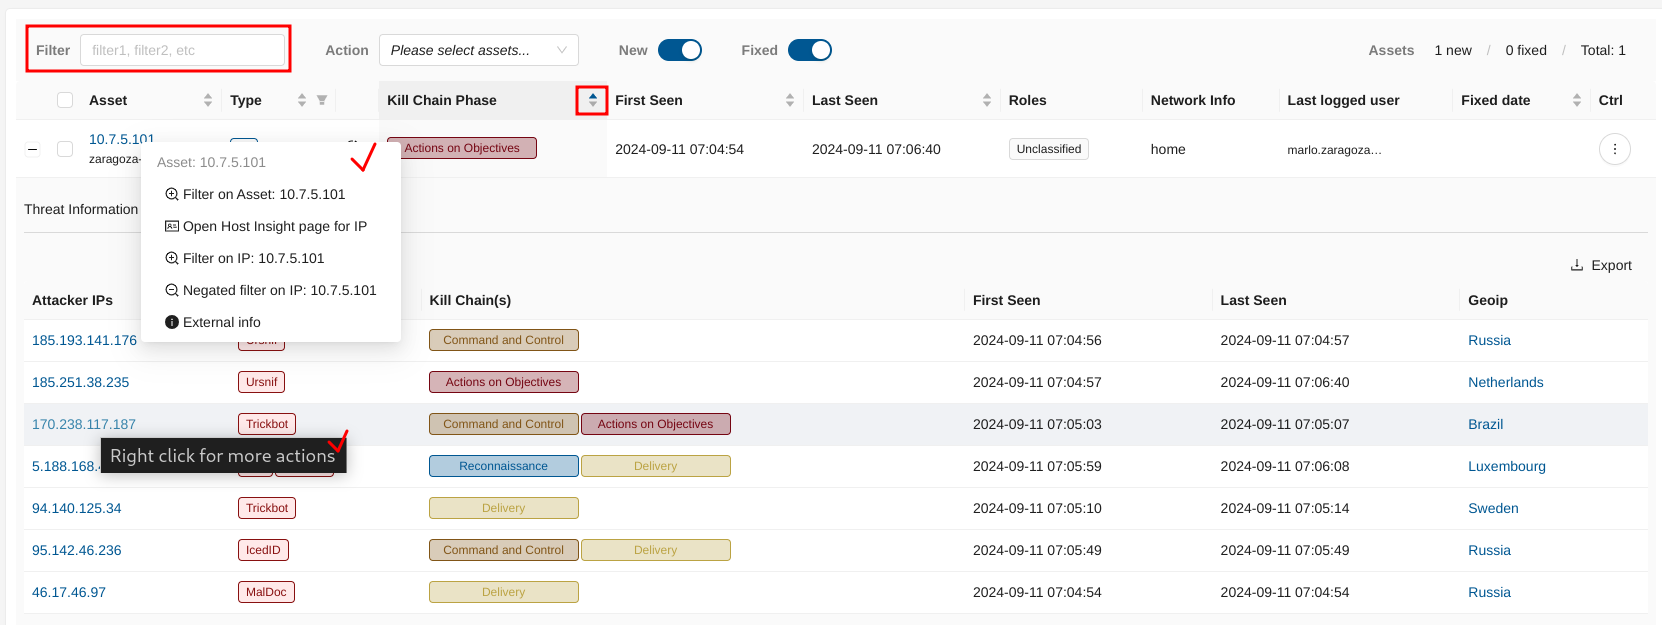
Assets Under Attack:
Shows a list of assets currently impacted by the threat, including details such as asset names, IP addresses, and hostnames.
Displays the kill chain phase each asset is currently in, helping users quickly identify where in the attack lifecycle each asset is affected.
Provides filters for refining the asset list by type, status (New, Fixed), and other attributes, enabling targeted analysis.
Kill Chain Visualization:
Illustrates the threat’s activity across different phases of the kill chain, such as Reconnaissance, Delivery, Exploitation, and Actions on Objectives.
Highlights the specific phases where the threat is currently active, aiding in understanding the progression and potential impact of the threat.
Tabs for Additional Information:
Assets: Lists all affected assets and their details.
Timeline: The Timeline tab visually displays the sequence of threat events over time, highlighting when and how assets were impacted. It represents different killchain phases and provides detailed event information on hover.
Additional Info: Offers extended information on the threat, including external links.
Investigate Events Button:
Similarly to the Investigate Events button on the Threat Family pages, this functionality allows you to delve deeper into specific events related to the threat (by automatically applying a
Threatbased filter), providing access to detailed evidence and enabling further investigation.
This page serves as a central point for analyzing a specific threat, offering all necessary data to understand its impact on the network and to take appropriate mitigation actions.
Assets Expanded View:
Threat Information Tab
The Threat Information tab provides a comprehensive overview of the selected threat, detailing its behavior, associated tactics, and impact on the network. This tab is designed to help security teams understand the nature of the threat and plan appropriate response actions.
Threat Description: Offers a detailed explanation of the threat, including its origins, typical behavior, and how it spreads. It often includes links to external sources for additional context and intelligence, such as MITRE or other threat databases.
Victim of: Lists the malware, exploits, or tools that are targeting or have been used against your assets. It provides context on how your assets are being exploited by the threat, along with associated tactics used by the attackers, such as phishing, malware delivery, or command and control activities.
Offender Using: Displays information about the offensive tools and techniques employed by the threat actors. This section includes details on how the attackers are leveraging specific tools, malware, or exploits to achieve their objectives.
Timeline: A chronological display of events related to the threat, showing when the threat was detected and how it has interacted with your network over time. This timeline helps in visualizing the threat’s progression and assists in correlating threat activities with observed network behavior.
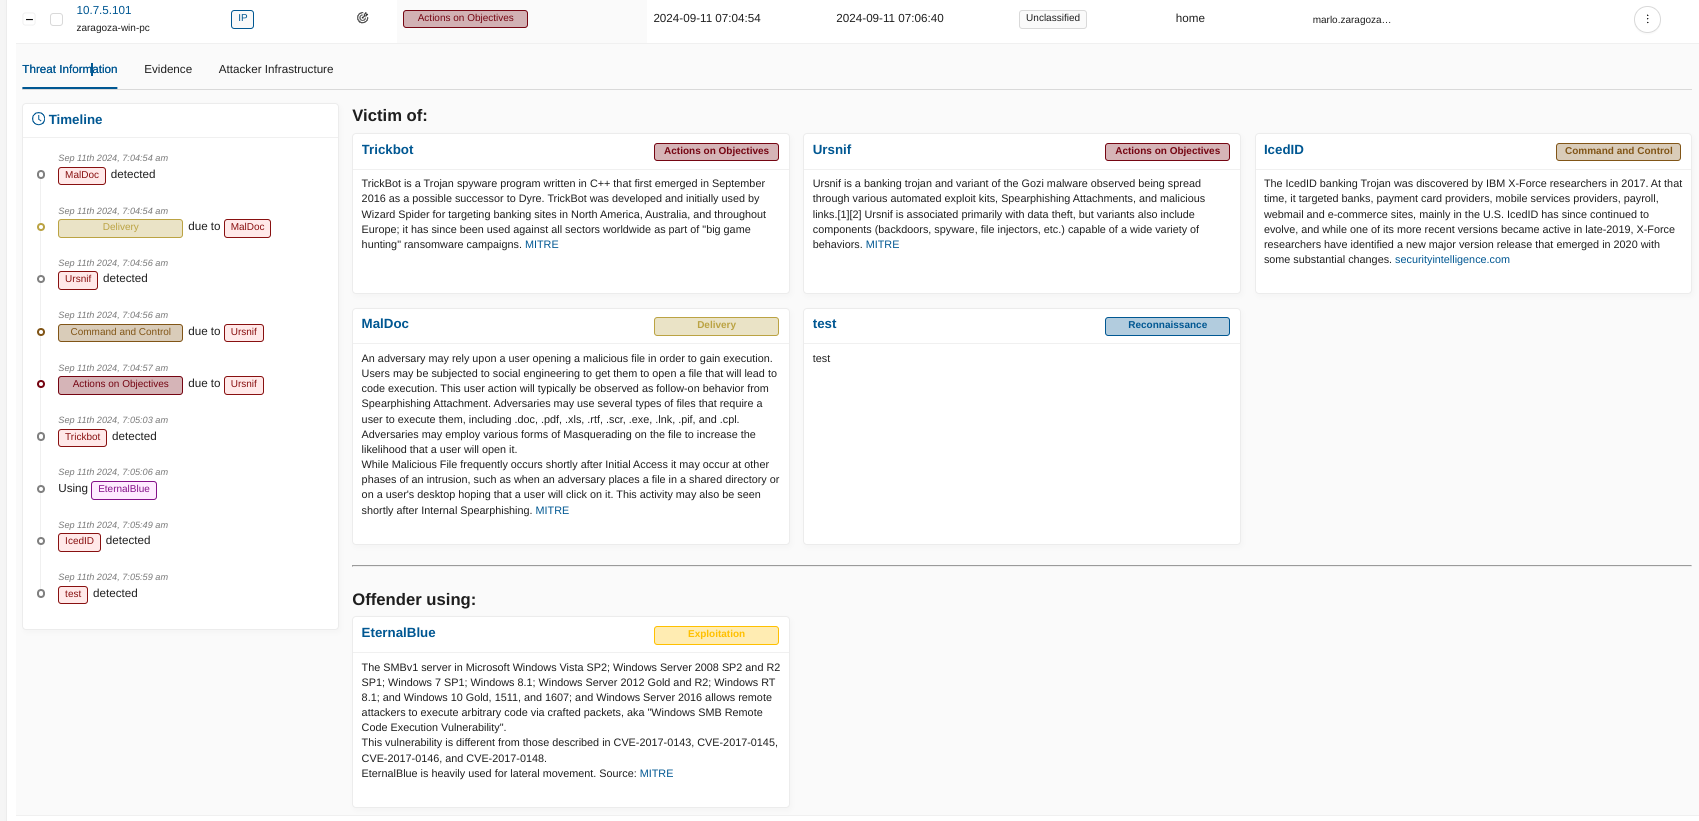
The Threat Information tab serves as a critical resource for understanding the specifics of a threat, including how it operates, what vulnerabilities it exploits, and the stages of the kill chain it affects. By providing detailed threat intelligence, this tab aids in the development of targeted mitigation and response strategies.
Evidence Tab: Provides a detailed view of the evidence collected related to the detected threat. This tab helps security teams analyze and understand the context of the threat, including the associated attacker infrastructure, threat activities, and their impact on your network.
Attacker IPs: Lists the IP addresses identified as part of the attacker infrastructure. These IPs are associated with various malicious activities or threat actors targeting your network.
Threat(s): Displays the specific threats linked to each attacker IP, such as malware, exploits, or other malicious tools used by the threat actors. Each threat is labeled for easy identification.
Kill Chain(s): Shows the phases of the kill chain where the identified threats are active, such as Command and Control, Delivery, or Actions on Objectives. This visualization helps in understanding the progression of the attack.
First Seen / Last Seen: Indicates the timestamps of when the threat activity was first and last observed, providing a timeline of the threat’s presence in the network.
GeoIP Information: Provides geographical information about the attacker IPs, showing the origin of the attacks based on IP geolocation data.
Export Option: Allows users to export the evidence data (in csv format) for further analysis, reporting, or sharing.

The Evidence tab consolidates critical information about threats and attacker activities, enabling a comprehensive analysis and aiding in decision-making for threat response actions.
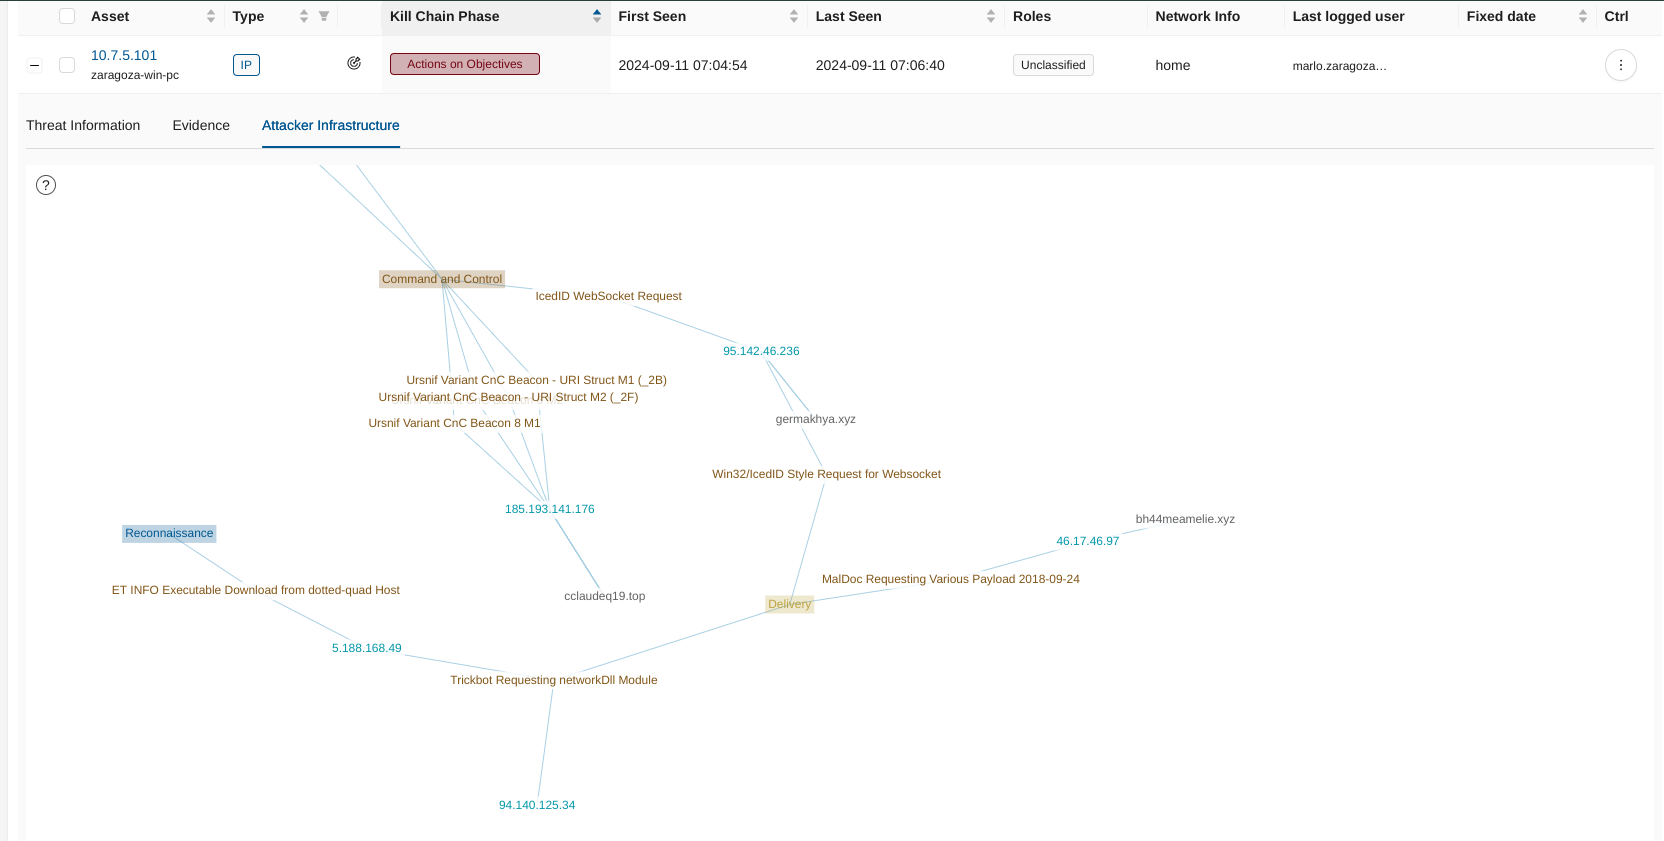
Attacker Infrastructure Tab
Very useful in visualizing the connections between attacker IPs, domains, and threat activities, mapping out the attacker’s network and highlighting associated kill chain phases.
In addition:
Filtering and Sorting: Use filter input field to refine the view of assets. Use sorting on tables by criteria such as kill chain phase, asset type, asset IP, first seen or last seen.
Navigation and Redirection: Use the left/right filter menus to easily navigate to related pages, such as hosts or policies, for broader context and to take further action.
The Threat page serves as a central hub for threat analysis, providing all necessary information to understand and mitigate threats effectively within the network.
Enabling or Disabling Threat Families and Specific Threats in a Ruleset
To enable or disable specific threat families or individual threats within a ruleset, follow these steps:
Navigate to the Rulesets Page: - Open the Management app and go to the Rulesets page.
Edit the Desired Ruleset: - Click on Edit Ruleset for the ruleset you want to modify.
Choose the Action: Under the Actions section, select one of the following options:
Enable/Disable Families: Choose this option if you want to enable or disable entire threat families.
Enable/Disable Threats: Select this option if you prefer to enable or disable specific threats within a family.
Select the Families or Threats: - Mark the relevant checkboxes for the threat families or individual threats you wish to enable or disable.
Submit Changes: - Click Submit to apply the changes to the ruleset.
These steps allow you to customize your threat detection by enabling or disabling specific threat categories or individual threats as needed.
This structure provides a clear and comprehensive guide to the Declarations of Compromise feature, covering all necessary components and interactions within the platform.
Custom Declarations of Compromise
From the Hunting interface, it is possible to create custom Declarations of Compromise (DoC) that will appear in the NDR app > Compromises > Coverage page > in the Custom Threats threat family.
Once you have created a filter that matches a specific threat in your environment, click the Policy Actions dropdown and select Create declaration events.
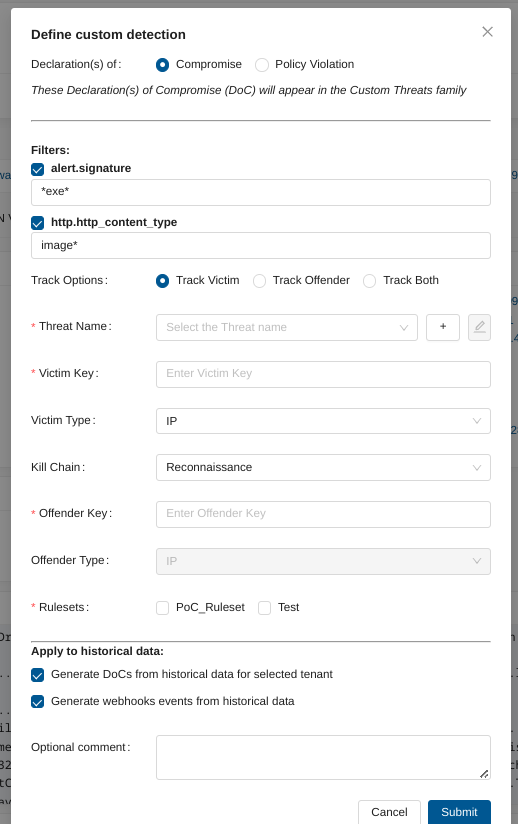
A modal will appear and let you configure the custom threat.
If the filter allows detecting an already existing threat, select that threat otherwise create a new threat by clicking on the + icon next to the Threat Name section.
Defining Custom Detection for Declarations of Compromise
Track Options:
You have three track options:
Track Victim: Focuses on the impacted asset, with the offender type predefined as IP.
Track Offender: Focuses on the attacking entity, allowing you to select the offender type (IP, Mail, or Username).
Track Both: Tracks both the victim and offender, with flexible offender type selection (IP, Mail, or Username).
Next, you would need to fill up:
Victim Key: Set this field to the field name that represents the impacted asset, such as src_ip or dest_ip.
Victim Type: Choose the type of the impacted asset. Options include IP, Username, or Mail.
Kill Chain: Select the phase of the kill chain that this detection pertains to, such as Reconnaissance or Command & Control.
Offender Key: Specify the field name that identifies the attacking system, such as src_ip or dest_ip.
Offender Type: (Available when Track Offender or Track Both is selected) Select the offender type: IP, Mail, or Username.
Ruleset: Select one or more rulesets in which to deploy those changes.
Then, you can decide to:
Generate Declaration of Compromise from historical data
Generate webhooks events from historical data
Depending on your environment, the generation of historical events may take some time. The progression can be observed under Status of tasks with a task named Stamus Events Creation (Management app > Appliances > Left Panel (Tasks) )
Important
Once a new Declaration of Compromise has been created, please update/push ruleset.
Note
Once you have created the custom DoC, you will be redirected to the Policies page, where a specific Policy action for that Declaration of Compromise will be created.
Important
Deleting the associated Policy action will automatically delete the associated custom threat.
Editing/Deleting a Custom Declaration of Compromise
From the Compromises section, go on Coverage page, then select the Custom Threats family. Click on the Threat you would like to manipulate. Once on the threat page, you will be able to edit the name, the description and additional information of that threat or delete it.
Important
Deleting the Custom Declaration of Compromise will automatically delete the associated Policy action.
Note that the fields Description and Additional Information are Markdown compatible and images can be embedded too as in this example:
# Example
This is a serious **Threat**

DoC Suppression
You may decide to suppress a Declaration of Compromise from appearing. There are two approaches to creating a suppression.
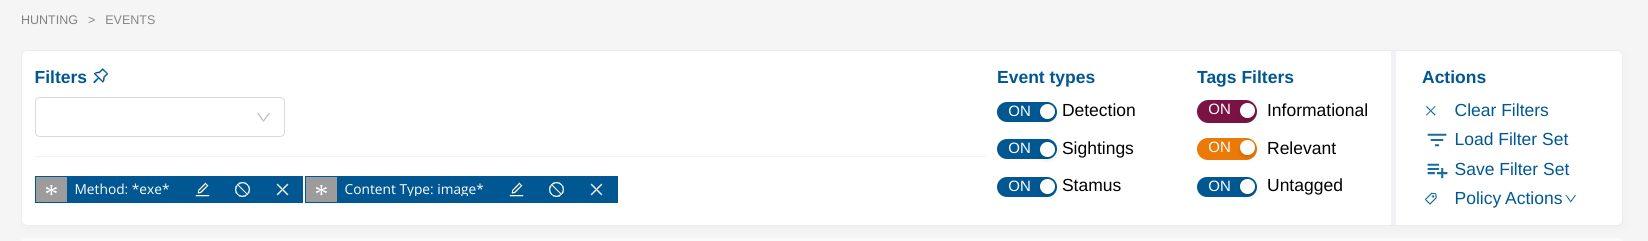
Suppress By Metadata Fields Combinations in Hunting
To suppress specific metadata fields combinations within the Stamus Central Server Platform, you can use the Hunting -> Dashboard interface. Follow the steps below to apply suppression policies based on your desired filters:
Navigate to the Hunting -> Dashboard Interface
Apply Filters of interest
Use the available filters in the Dashboard to select the metadata fields and values that you want to suppress. This can be any combination of fields relevant to your needs.
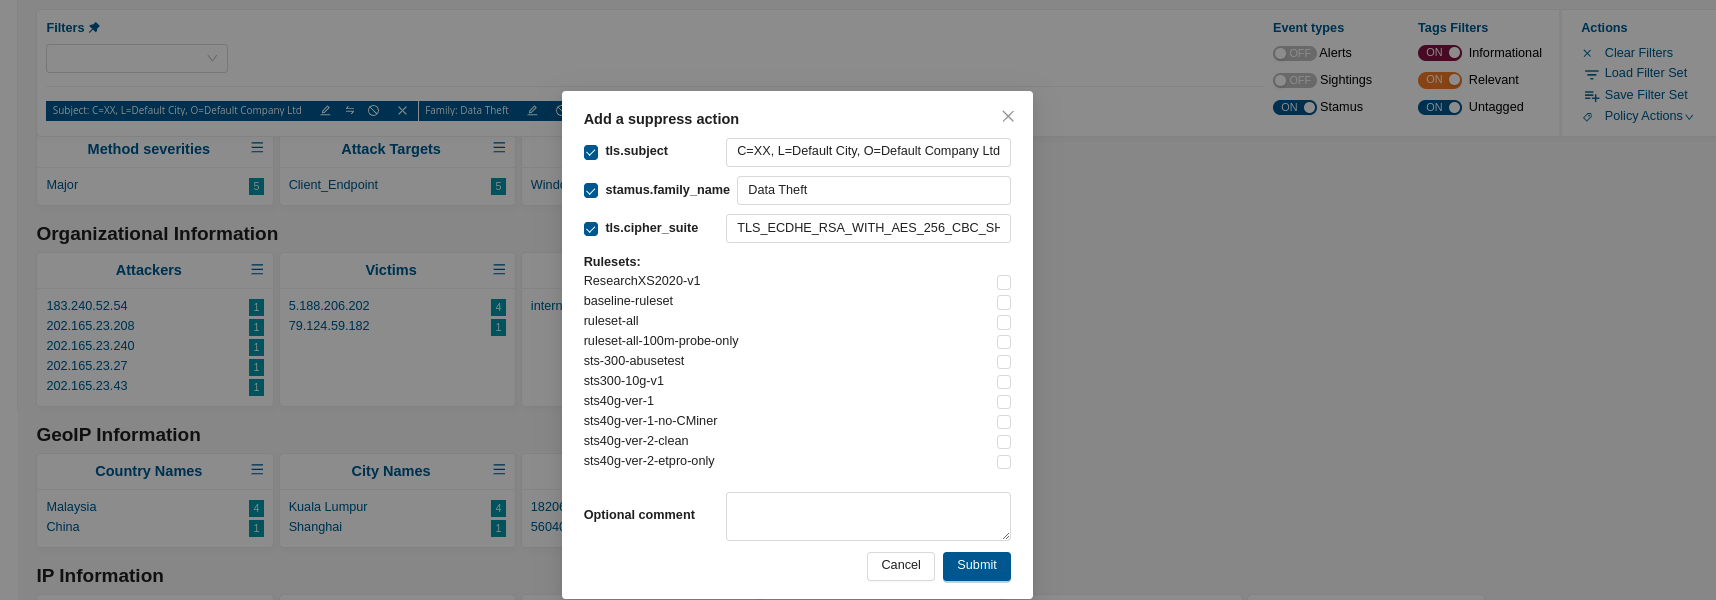
Add a Suppress Action:
Once you have applied the desired filters, open the Policy Actions menu.
Select Add a suppress Action from the dropdown.
Submit the Suppress Policy Action:
Review your suppression settings and click Submit.
Upon submission, you will be automatically redirected to the Policies page where your new suppression policy is listed.
Important
Don’t forget to update/push the ruleset to ensure that the suppression policy action is propagated throughout the system. This step is essential for your changes to take effect and be enforced during threat detection and response.
By following these steps, you can effectively suppress specific metadata fields combinations, improving the accuracy and relevance of your threat detection in the Stamus Security Platform.
Suppress By Method ID and IP address
With this approach, the suppression will be performed by combining a Method ID and an IP address, or subnet, of an Offender.
To do so:
Go to Management app
Go to the Rulesets page
Click on Edit ruleset (ruleset where the DoC is deployed)
Under Expert mode, configure event suppression under Suppress events
Update/push ruleset in order to apply the suppression
suppress gen_id 2, sig_id 1002025885, track by_src, ip 107.182.230.25/8
The tracking can be either by_src, by_dst or by_either.
Note
gen_id corresponds to the gid of the signature, which is always 2 for Declarations of Compromise
Note
Variables can be used for the ip as well but make sure that this variable is defined on the probe settings
suppress gen_id 2, sig_id 1002025885, track by_either, $SCANNERS
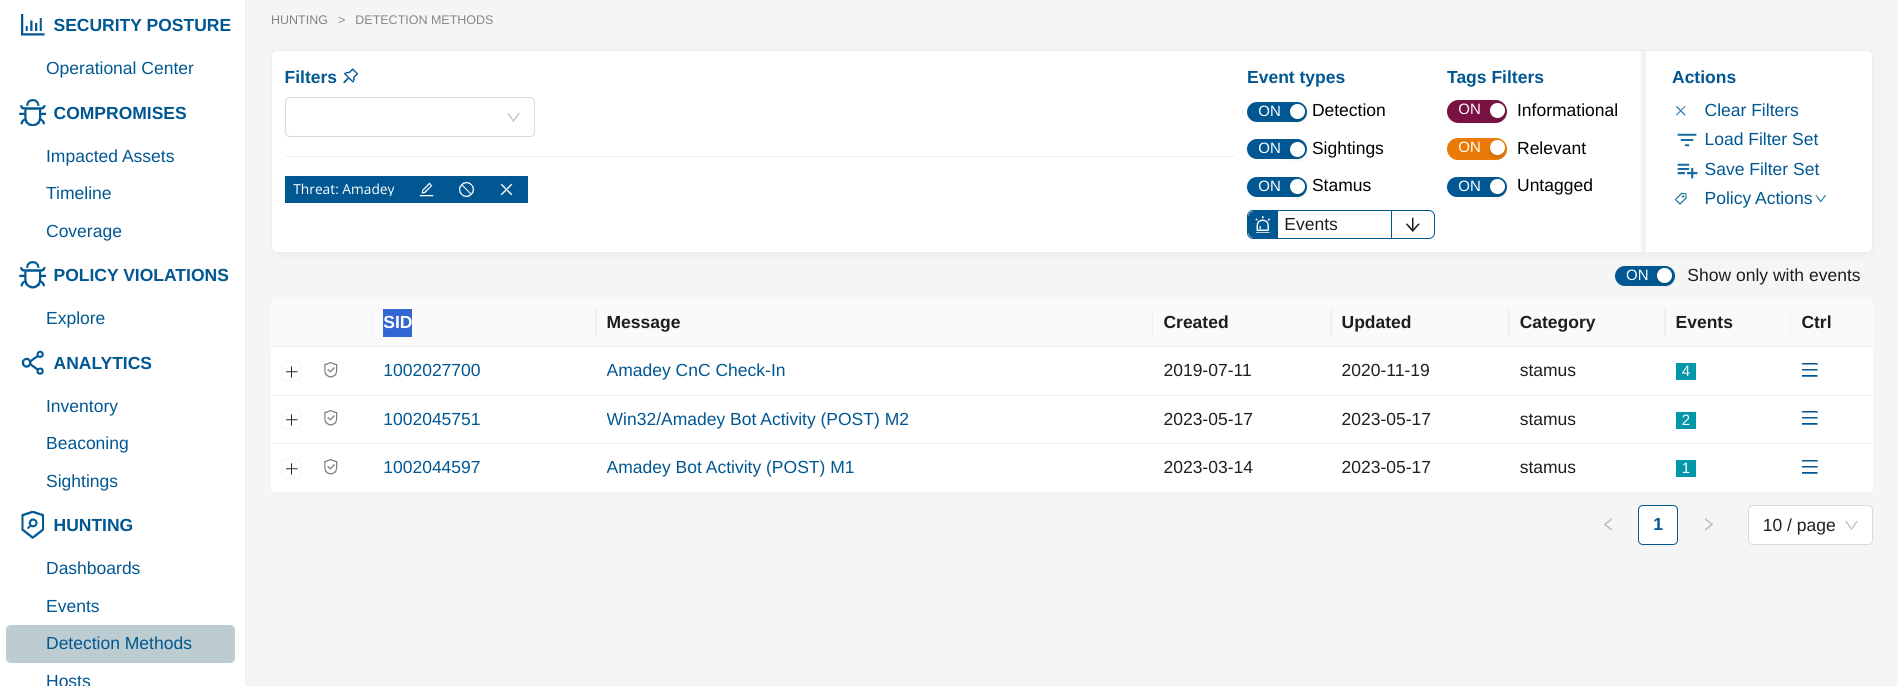
Finding the sig_id
To find the sig_id required for the event suppression, go under Compromises and:
Go to Impacted Assets page
Choose an asset of interest from the Assets Table
Select a Threat Family and click on it
Once on the Threat page - use the Investigate events button to apply a filter on that threat
Under Hunting - go to Detection Methods page.
The filtered results will help you identify the sig_id of the appropriate signature(s) as illustrated in the following screenshot
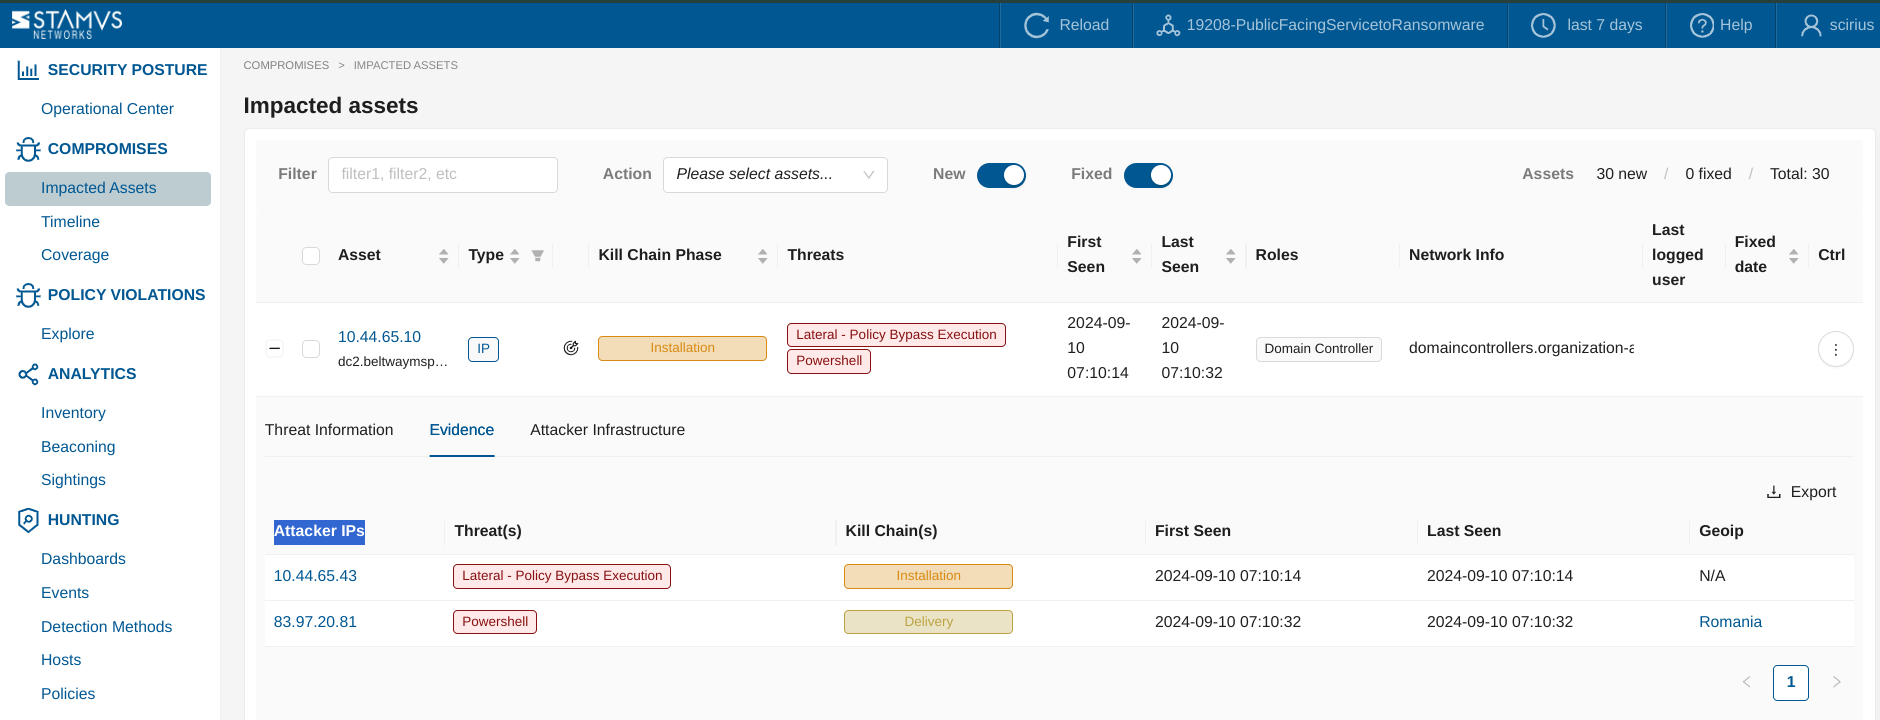
Find the Offender IP
To find the Offender IP required for the event suppression, go under Compromises and:
Go to Impacted Assets page
Select an asset of interest and expand it
Go to the Evidence tab
Check Attacker IPs from the table
Email Notifications for DoC Events
The Stamus Central Server (SCS) supports sending email notifications when a Declaration of Compromise (DoC) is generated in Scirius. This feature functions similarly to webhooks, providing automated alerts to designated recipients, enabling timely response and integration into existing workflows.
To use the automated email alerts for DoC detection, you need to enable the SMTP server by going to the Management app, navigating to Global Appliance Settings, and selecting the SMTP tab to configure and enable your SMTP server settings. Once configured, email notifications for DoC events will be activated.
Example:
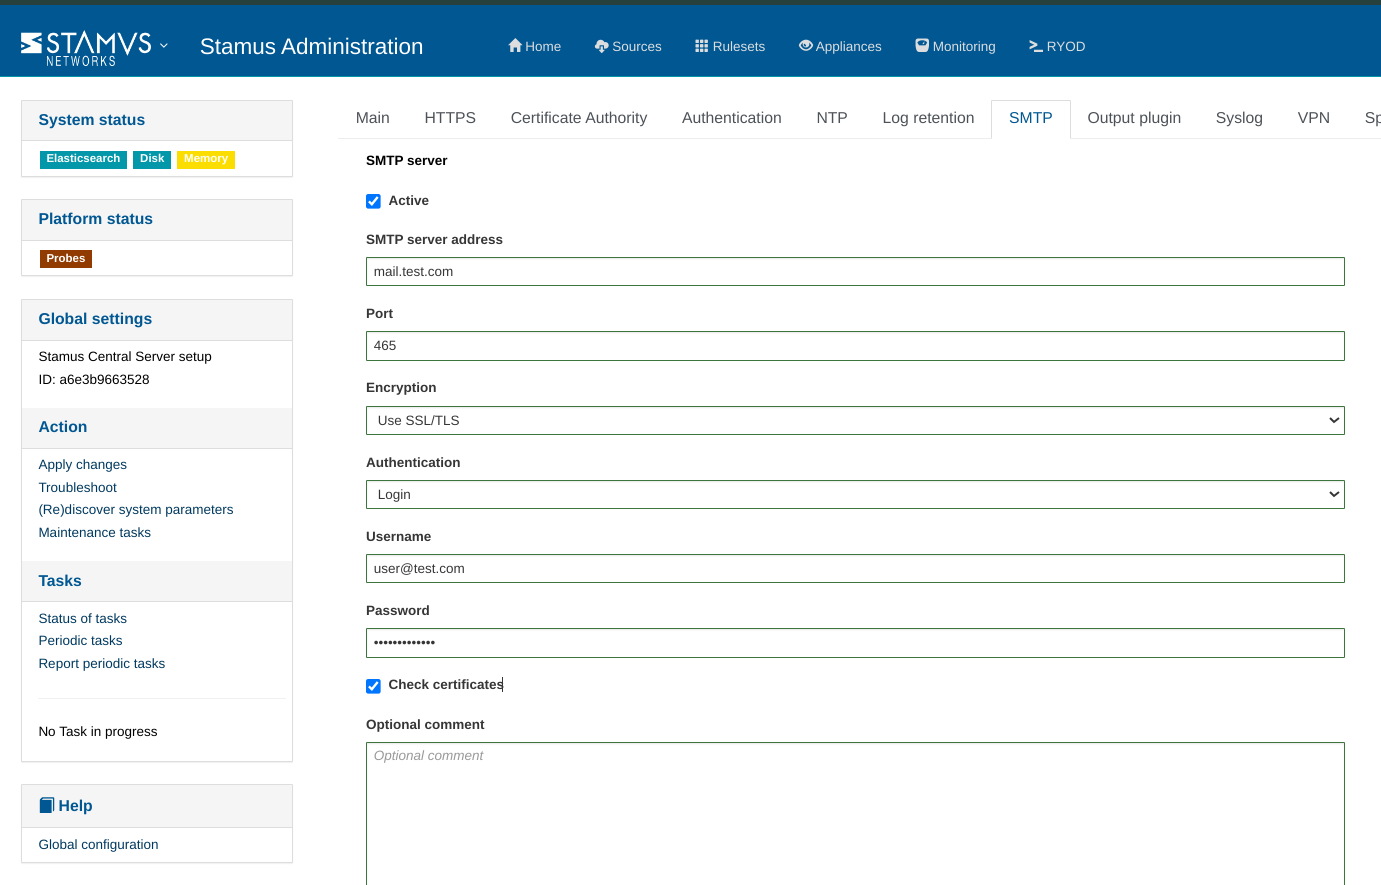
Note
Do not forget to Apply changes in order to propagate the SMTP configuration to the system.
To set up email notifications for DoC detection, from the Management app, navigate to the Integrations menu, and select the Emails tab. Then, click the Add Item button to configure the email alert settings for DoC events.
Example:
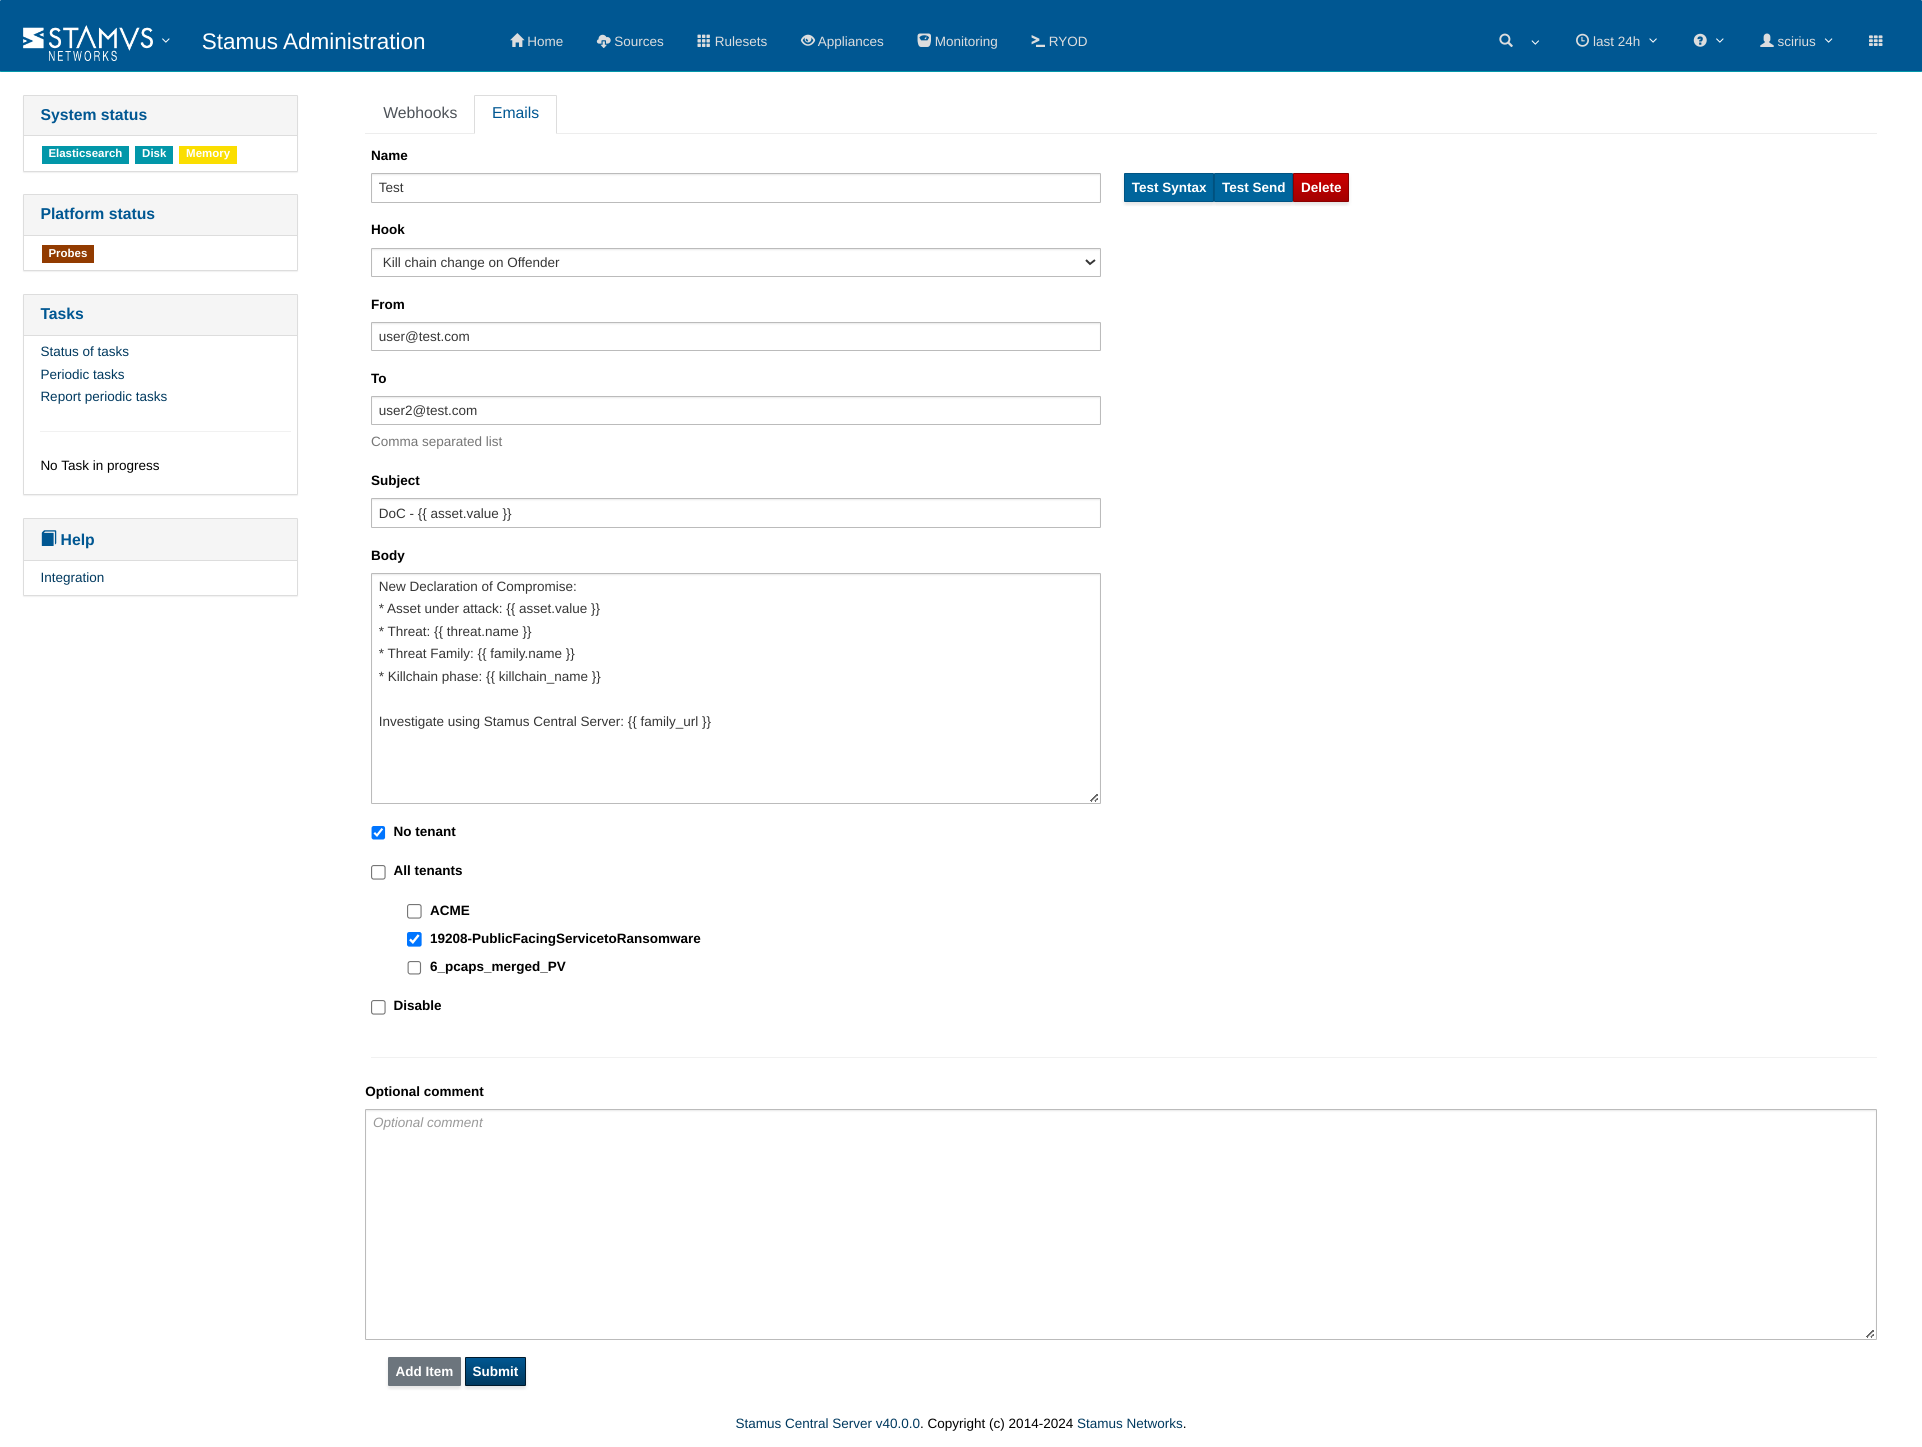
Additionally, you can configure tenant settings by selecting No tenant, All tenants, and/or specifying particular tenants as needed.
Once all information is completed, click Submit to save your configuration.
Note
An Apply changes is not needed on this step.