
Warning: You are viewing an older version of this documentation. Most recent is here: 42.2.0
Analytics
Beacons and Sightings detection require a NDR license.
Beaconing
Beacons are recurring communications that are often used by Malware to exfiltrate data or check back with a Command and Control server if new instructions await.
Hint
Beacons detection difficulties come from detecting very slow beacons such as one connection every few days as most detection systems aren’t designed to deal with such low frequency.
Stamus Central Server is capable of detecting slow beacons using Machine Learning, including very slow beacons. Our algorithms don’t have time boundaries.
In practice, we have commonly observed malware sending few beacons per day or per week which our system is capable of detecting easily.
Beacon Metric
Stamus Central Server computes a Beacon Metric which is a weighted score prioritizing TLS servers exhibiting behavior patterns typically associated with beaconing traffic. In other words, communications with clear periodicity or flat byte and specific packet profiles are highlighted by this mechanism.
For example, a command and control (C2) callback beacons are periodic outbound connections for maintaining persistence. They call home at specific intervals, though they can also be configured to vary that callback with predefined jitter. Most callbacks also deliver the same amount of data per request and response.
Our system first performs frequent item detection to profile the TLS traffic for your organization and exclude them from the beacon analysis.
Remaining connections are therefore infrequent, and have heightened risk of being a beacon. From these remaining connections, statistical measurements are collected for each potential beacon.
Stamus Central Server performs many statistical measurements, which taken individually, are not enough to characterize a beacon. However, the combination of these statistical measurements result in a beacon metric, a single unique value to sort the tracking table.
The beacon metric can range from 0 to 100. Entries at the top exhibit beaconing patterns more strongly than entries at the bottom.
Note that many legitimate communications often also exhibit beaconing patterns. For example, software updates, API calls, telemetry services, etc. Our system tries to deprioritize these entries by analyzing Server Name Indicators (SNI) to identify known services. Nevertheless, it is normal to see these in the beaconing tab because they may indicate policy violations or abnormal findings in the network.
This beacon metric being an indicator of likelihood, the best approach is to use it as a starting point for investigation (and then look at the SNI(s) for example in the details page).
The beacon metric is not a percentage that a particular entry is a beacon. It simply prioritizes more relevant entries for investigation.
For a potential beaconing entry:
Investigate TLS SNI values to identify if this is a malicious domain or a known service (for example, Microsoft update services vs a randomly generated domain)
Investigate TLS issuer, self-signed certificates or Let’s Encrypt are often used by malicious servers;
Investigate the traffic profile to see if connections occur at specific intervals or if the data profile is flat;
Important
In no way this beacon metric should be interpreted as a “percentage of chances” as this metric is a relative statistical measurement.
Sightings
Sightings detects new communication artifacts, never observed before in your environment, such as a HTTP User-Agent, a domain name, a JA3 hash, and so on.
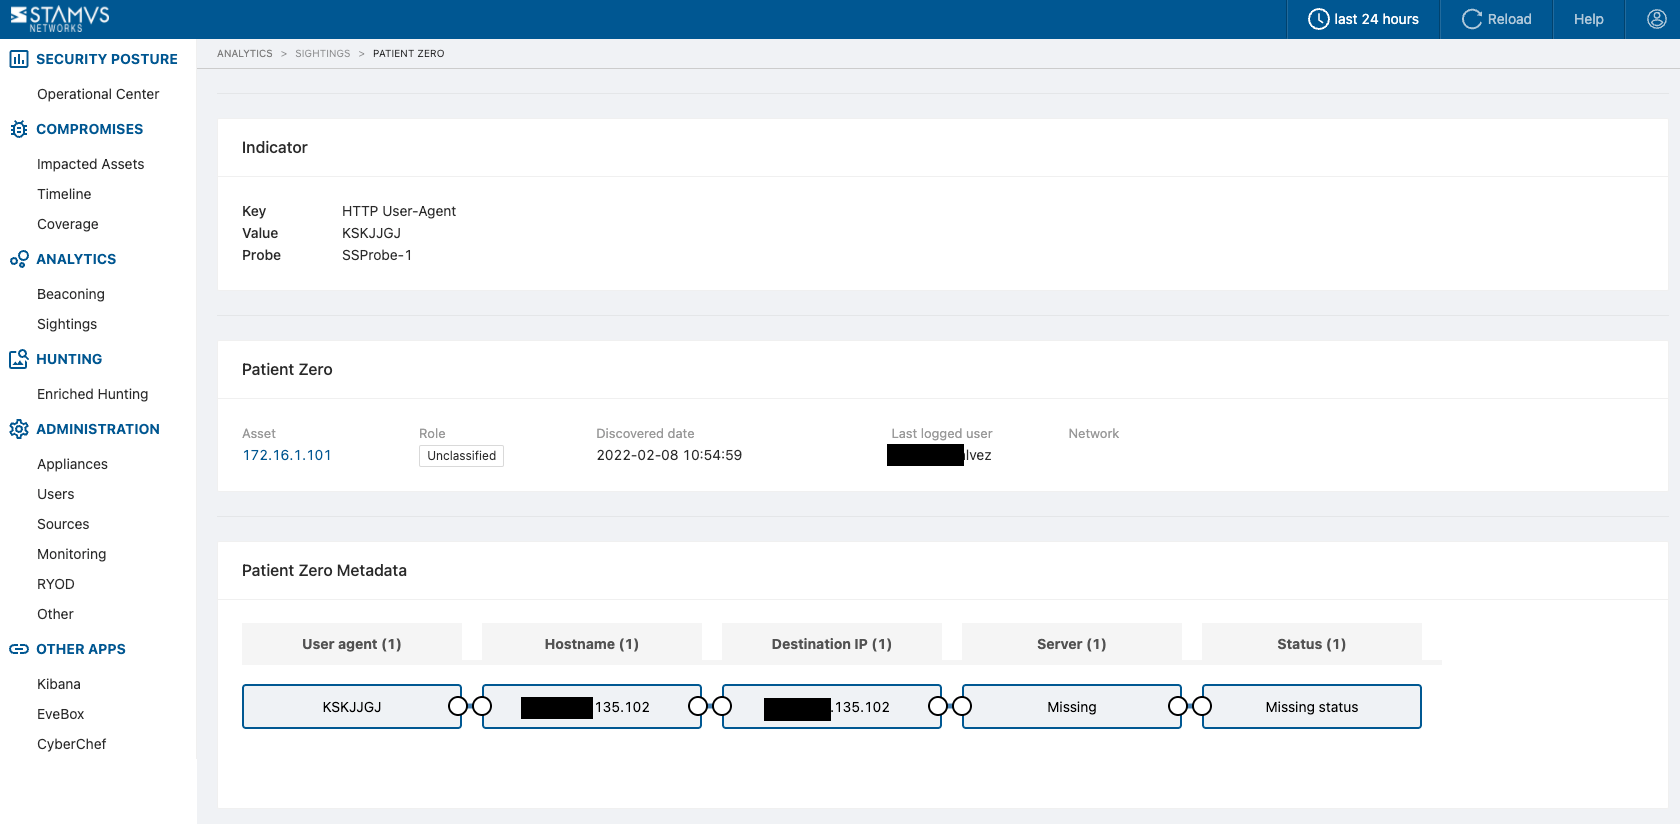
The details page for each Sighting event will display:
The indicator observed (key/value pair)
The patient zero information (who generated this Sighting first)
The patient zero metadata (technical information related to this Sighting from patient zero)
The network metadata graph (a timeline of when this Sighting was observed)
The flow chart metadata visualization (all metadata from all hosts having contacted/used the same Sighting)
Sightings are really handy and powerful when performing combined analysis. For example, one could cross check Sightings with potential beacons, hence discovering beacons to a never observed before TLS SNI (domain) for example. Similarly, we could hunt downloaded executables from never seen before domain names.
The currently observed artifacts are:
dns.query
http.host
ja3s.hash
tls.sni
tls.cert_subject
tls.cert_serial
tls.cert_issuer
http.user_agent
ja3.hash
ssh.software (client and server)
file.name (samba protocol)
http.server
To enable Sightings, simply go under Probe Management, edit a Network Probe or a Template, and check the option Logging of newly discovered values under the tab Filters.
Important
Advanced users might want to enable/disable Sightings at the fields level, or add new fields to be monitored. This is technically possible, please contact support@stamus-networks.com for scoping and guidance.
Hint
Sightings can be used by Policies. One can create a suppression or an escalation policy.
For example, the usage of a new HTTP User-Agent on a Domain Controller is something that shouldn’t be often observed in an environment, except after system upgrades.
This example can be achieved using a Sighting event (a newly observed HTTP User-Agent) and a Network Definition (Domain Controller) for example.
Sightings and multiple probes
As of U38, the current Sightings logic is on a per probe basis. This means, if an artifact such as a domain name like microsoft.com is first observed by one probe, a second probe will not have this knowledge. As a consequence, the first time the very same domain will be observed by the second probe, a new Sighting event will be generated, resulting in a total of 2 Sightings events in the summary table, one per probe.
Training period
When enabled, Sightings may generate some noise depending on your environment. This is why it is recommended to wait a week or so before drilling down into Sightings events, the time for actual traffic artifacts to be observed and added to the Sighting cache.
Buffer size
Each field monitored, such as dns.query, http.host, ja3s.hash, etc, have a dedicated cache. This cache, to simplify, is of 1 million entries (some specific fields have a smaller cache size).
There is no notion of time or expiration in this cache. Once an entry is added to the cache, it is there forever. Entries don’t expire.
If you absolutely need to make expire an entry, please contact support@stamus-networks.com
Rebooting a Network Probes, or pushing a new ruleset, doesn’t flush the cache. The cache is reboot persistent. In the worst case, if a Network Probe is dysfunctional, one may lose a few hundreds of entries (but you probably will have other issues first!)
To see the current number of entries in your cache, simply go to the Hunting / Dashboard page, and only select Sightings (discard Alerts). The first card should show you the number of entries per field.
Hint
Stamus Central Server whitelists the most common domains such as windowsupdate.com and alike. Cloud providers, despite being common, are not whitelisted as they can also be used by adversaries.
Note
To tweak this cache size if your environment requires it, contact support@stamus-networks.com